
Page 284 - Solid Waste Analysis and Minimization a Systems Approach
P. 284
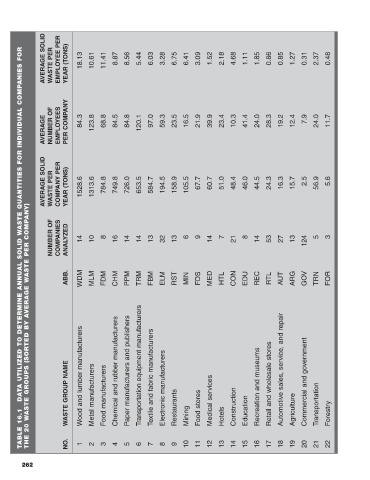
AVERAGE SOLID   WASTE PER   EMPLOYEE PER   YEAR (TONS)  18.13  10.61  11.41  8.87  8.56  5.44  6.03  3.28  6.75  6.41  3.09  1.52  2.18  4.68  1.11  1.85  0.86  0.85  1.27  0.31  2.37  0.48


        DATA UTILIZED TO DETERMINE ANNUAL SOLID WASTE QUANTITIES FOR INDIVIDUAL COMPANIES FOR


                AVERAGE   NUMBER OF   EMPLOYEES    PER COMPANY  84.3  123.8  68.8  84.5  84.8  120.1  97.0  59.3  23.5  16.5  21.9  39.9  23.4  10.3  41.4  24.0  28.3  19.2  12.4  7.9  24.0  11.7


                AVERAGE SOLID   WASTE PER   COMPANY PER   YEAR (TONS)  1528.6  1313.6  784.8  749.8  726.0  653.5  584.7  194.5  158.9  105.5  67.7  60.7  51.0  48.4  46.0  44.5  24.3  16.3  15.7  2.5  56.9  5.6


          THE 20 WASTE GROUPS (SORTED BY AVERAGE WASTE PER COMPANY)

                  NUMBER OF   COMPANIES   ANALYZED  14  10  8  16  14  14  13  32  13  6  9  14  7  21  8  14  53  27  13  124  5  3


                       ABB.  WDM  MLM  FDM  CHM  PPM  TRM  FBM  ELM  RST  MIN  FDS  MED  HTL  CON  EDU  REC  RTL  AUT  ARG  GOV  TRN  FOR


                       WASTE GROUP NAME Wood and lumber manufacturers  Metal manufacturers  Food manufacturers Chemical and rubber manufacturers Paper manufacturers and publishers Transportation equipment manufacturers Textile and fabric manufacturers  Electronic manufacturers  Restaurants  Food stores  Medical services  Construction  Recreation and museums Retail and wholesale stores Automotive sales, service, and repair  Agriculture Commercial and government  Transportation


        TABLE 16.1     NO.  1   2   3   4   5   6   7  8   9   Mining  10  11  12  Hotels  13  14  Education  15  16  17  18  19  20  21  Forestry  22


        262