
Page 281 - Solid Waste Analysis and Minimization a Systems Approach
P. 281
SUMMARY OF WASTE CHARACTERIZATION FINDINGS 259
ORGANICMEAN
BIOMEAN
OILMEAN
CDMEAN
RUBBERSTD
CDSTD
FOODMEAN
RUBBERMEAN
METALMEAN
FABRICSTD
FABRICMEAN
Index of case PAPERMEAN
METALSTD
WOODMEAN
BIOSTD
OILSTD
PLASTICMEAN
YARDMEAN
PLASTICSTD
GLASSSTD
ORGANICSTD
GLASSMEAN
WOODSTD
PAPERSTD
FOODSTD
OCCSTD
OCCMEAN
YARDSTD
–5 0 5 10
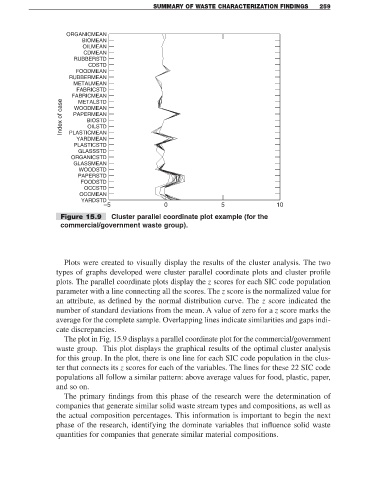
Figure 15.9 Cluster parallel coordinate plot example (for the
commercial/government waste group).
Plots were created to visually display the results of the cluster analysis. The two
types of graphs developed were cluster parallel coordinate plots and cluster profile
plots. The parallel coordinate plots display the z scores for each SIC code population
parameter with a line connecting all the scores. The z score is the normalized value for
an attribute, as defined by the normal distribution curve. The z score indicated the
number of standard deviations from the mean. A value of zero for a z score marks the
average for the complete sample. Overlapping lines indicate similarities and gaps indi-
cate discrepancies.
The plot in Fig. 15.9 displays a parallel coordinate plot for the commercial/government
waste group. This plot displays the graphical results of the optimal cluster analysis
for this group. In the plot, there is one line for each SIC code population in the clus-
ter that connects its z scores for each of the variables. The lines for these 22 SIC code
populations all follow a similar pattern: above average values for food, plastic, paper,
and so on.
The primary findings from this phase of the research were the determination of
companies that generate similar solid waste stream types and compositions, as well as
the actual composition percentages. This information is important to begin the next
phase of the research, identifying the dominate variables that influence solid waste
quantities for companies that generate similar material compositions.