Page 285 - Solid Waste Analysis and Minimization a Systems Approach
P. 285

OVERVIEW OF WASTE GROUP DATA AND CONSOLIDATION              263


                       1800
                       1600

                     Annual solid waste (tons)  1200
                       1400


                       1000

                        800
                        600

                        400
                        200

                          0
                               WDM  MLM  FDM  CHM  PPM  TRM  FBM  ELM  RST  MIN  FDS  MED  TRN  HTL  CON  EDU  REC  RTL  AUT  ARG  FOR  GOV


                                                 22 Waste groups
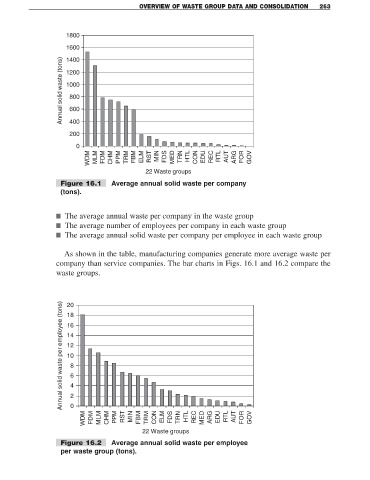
                     Figure 16.1      Average annual solid waste per company
                     (tons).


                    ■ The average annual waste per company in the waste group
                    ■ The average number of employees per company in each waste group
                    ■ The average annual solid waste per company per employee in each waste group


                      As shown in the table, manufacturing companies generate more average waste per
                    company than service companies. The bar charts in Figs. 16.1 and 16.2 compare the
                    waste groups.


                     Annual solid waste per employee (tons)
                       20
                       18

                       16
                       14
                       12
                       10
                        8
                        6
                        4
                        2
                        0
                             WDM  FDM  MLM  CHM  PPM  RST  MIN  FBM  TRM  CON  ELM  FDS  TRN  HTL  REC  MED  ARG  EDU  RTL  AUT  FOR  GOV

                                                22 Waste groups

                     Figure 16.2      Average annual solid waste per employee
                     per waste group (tons).
   280   281   282   283   284   285   286   287   288   289   290