
Page 273 - Solid Waste Analysis and Minimization a Systems Approach
P. 273
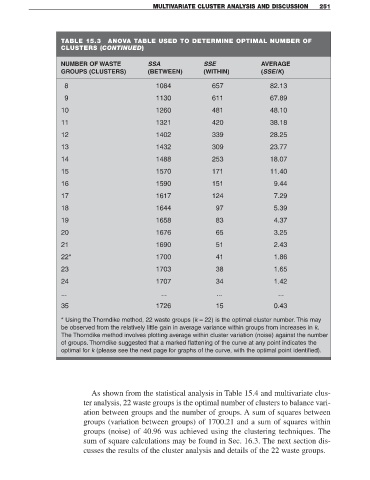
MULTIVARIATE CLUSTER ANALYSIS AND DISCUSSION           251


                     TABLE 15.3      ANOVA TABLE USED TO DETERMINE OPTIMAL NUMBER OF
                     CLUSTERS (CONTINUED)


                     NUMBER OF WASTE              SSA               SSE                AVERAGE
                     GROUPS (CLUSTERS)            (BETWEEN)         (WITHIN)           (SSE/K)

                      8                              1084              657                82.13

                      9                              1130              611                67.89
                     10                              1260              481                48.10

                     11                              1321              420                38.18
                     12                              1402              339                28.25

                     13                              1432              309                23.77
                     14                              1488              253                18.07

                     15                              1570              171                11.40
                     16                              1590              151                  9.44

                     17                              1617              124                  7.29
                     18                              1644               97                  5.39

                     19                              1658               83                  4.37
                     20                              1676               65                  3.25

                     21                              1690               51                  2.43
                     22*                             1700               41                  1.86

                     23                              1703               38                  1.65

                     24                              1707               34                  1.42
                     ...                              ...                ...                 ...
                     35                              1726               15                  0.43


                     * Using the Thorndike method, 22 waste groups (k = 22) is the optimal cluster number. This may
                     be observed from the relatively little gain in average variance within groups from increases in k.
                     The Thorndike method involves plotting average within cluster variation (noise) against the number
                     of groups. Thorndike suggested that a marked flattening of the curve at any point indicates the
                     optimal for k (please see the next page for graphs of the curve, with the optimal point identified).


                               As shown from the statistical analysis in Table 15.4 and multivariate clus-
                             ter analysis, 22 waste groups is the optimal number of clusters to balance vari-
                             ation between groups and the number of groups. A sum of squares between
                             groups (variation between groups) of 1700.21 and a sum of squares within
                             groups (noise) of 40.96 was achieved using the clustering techniques. The
                             sum of square calculations may be found in Sec. 16.3. The next section dis-
                             cusses the results of the cluster analysis and details of the 22 waste groups.