
Page 35 - Solid Waste Analysis and Minimization a Systems Approach
P. 35
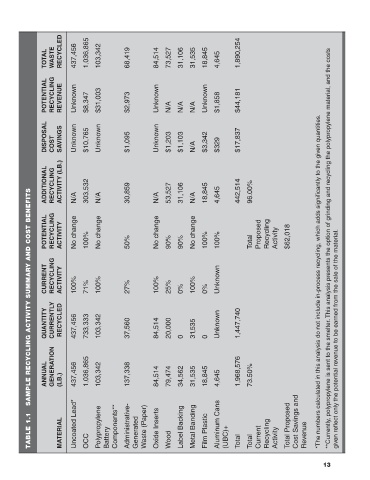
TOTAL  WASTE  RECYCLED  437,456  1,036,865  103,342  68,419  84,514  73,527  31,106  31,535  18,845  4,645  1,890,254


                POTENTIAL  RECYCLING  REVENUE   Unknown  $8,347  $31,003  $2,973  Unknown  N/A  N/A  N/A  Unknown  $1,858   $44,181


                DISPOSAL  COST  SAVINGS  Unknown  $10,765  Unknown  $1,095  Unknown  $1,203  $1,103   N/A  $3,342   $329   $17,837


                ADDITIONAL  RECYCLING  ACTIVITY (LB.)  N/A  303,532  N/A  30,859  N/A  53,527  31,106  N/A  18,845  4,645  442,514  96.00%


           SAMPLE RECYCLING ACTIVITY SUMMARY AND COST BENEFITS


                POTENTIAL  RECYCLING  ACTIVITY  No change  100%  change  No  50%  No change  90%  90%  No change  100%  100%  Total  Proposed  Recycling  Activity  $62,018  **Currently, polypropylene is sent to the smelter. This analysis presents the option of grinding and recycling the polypropylene material, and the costs


                CURRENT  RECYCLING  ACTIVITY  100%  71%  100%  27%  100%  25%  0%  100%  0%  Unknown       *The numbers calculated in this analysis do not include in-process recycling, which adds significantly to the given quantities.


                QUANTITY  CURRENTLY  RECYCLED  437,456  733,333  103,342  37,560  84,514  20,000  0  31 ,535  0  Unknown  1,447,740  given reflect only the potential revenue to be earned from the sale of the material.


                ANNUAL  GENERATION  (LB.)  437,456  1,036,865  103,342  137,338  84,514  79,474  34,562  31,535  18,845  4,645  1,968,576  73.50%


           1.1            Uncoated Lead*  Polypropylene  Components**  Administrative-  Waste (Paper)  Label Backing  Metal Banding  Aluminum Cans   Total Proposed   Cost Savings and

           TABLE     MATERIAL  OCC   Battery   Generated    Oxide Inserts  Wood  Film Plastic  (UBC)+  Total  Total  Current  Recycling  Activity  Revenue


                                                                                                            13