
Page 316 - Standard Handbook Petroleum Natural Gas Engineering VOLUME2
P. 316
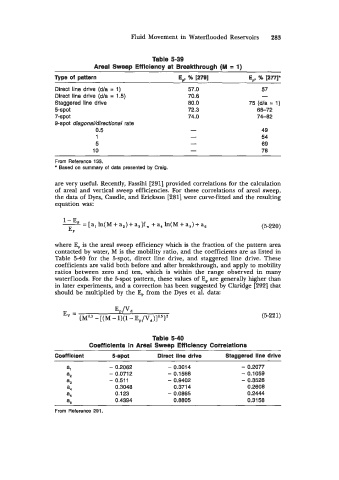
Fluid Movement in Waterflooded Reservoirs   283


                                              Table 5-39
                             Areal  Sweep Efficiency at Breakthrough (M  = 1)
                 Type of  pattern                     E,,  % 12791         E,,  % [2771*
                 Direct line drive (d/a = 1)             57.0                  57
                 Direct line drive (d/a = 1.5)           70.6                  -
                 Staggered line drive                    80.0              75 (d/a = 1)
                 5-spot                                  72.3                68-72
                 7-spot                                  74.0                74-82
                 9-spot  diagonal/directional rate
                             0.5                                               49
                              1                                                54
                             5                                                 69
                             10                                                78
                       ~       ~      ~      ~
                 From Reference 133.
                   Based on summary of  data presented by Craig.
                 are very useful. Recently, Fassihi [291] provided correlations for the calculation
                 of  areal and vertical sweep efficiencies. For  these correlations of  areal sweep,
                 the data of  Dyes, Caudle, and Erickson [281] were curve-fitted and the resulting
                 equation was:
                    '-

                          = [a, ln(M + as)+ a,]f,  + a4 In(M + a,)+ as         (5-220)
                     E,

                 where E,  is  the -areal sweep efficiency which is the fraction of the pattern area
                 contacted by water, M is the mobility ratio, and the coefficients are as listed in
                 Table 5-40  for  the  5-spot, direct  line  drive,  and  staggered line  drive. These
                 coefficients are valid both before and after breakthrough, and apply to mobility
                 ratios  between  zero  and  ten,  which  is  within  the  range  observed  in  many
                 waterfloods. For the 5-spot pattern, these values of  E,  are generally higher than
                 in later experiments, and a correction has been suggested by  Claridge [292] that
                 should be  multiplied by  the E, from the Dyes et al. data:


                    E,  =          EPPd
                         {M0.5 -[(M  - 1)(1-  Ep/V,)]0.5}'                     (5-221)


                                              Table 5-40
                            Coefficlents in Areal  Sweep Eff lclency Corretatlons
                 Coefficient      5-SpOt        Direct line drive   Staggered line drive

                     a,           - 0.2062         - 0.3014              - 0.2077
                     a2           - 0.0712         - 0.1568              - 0.1059
                                  - 0.511          - 0.9402              - 0.3526
                     a3
                     a4            0.3048            0.3714                0.2608
                     a5            0.123           - 0.0865               0.2444
                     a,            0.4394            0.8805               0.3158
                 From Reference 291.