
Page 320 - Standard Handbook Petroleum Natural Gas Engineering VOLUME2
P. 320
Fluid Movement in Waterflooded Reservoirs 287
IO I I l l I I I I I ~ I I I I ~ I I
0.01 0.1 0.5 I 2 5 IO 20 3040508070 80 90 95 9899
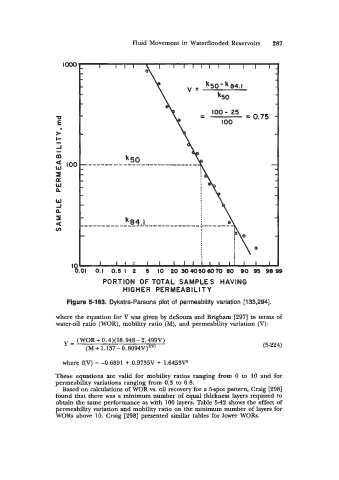
PORTION OF TOTAL SAMPLES HAVING
HIGHER PERMEABILITY
Figure 5-163. Dykstra-Parsons plot of permeability variation [133,294].
where the equation for Y was given by deSouza and Brigham [297] in terms of
water-oil ratio (WOR), mobility ratio (M), and permeability variation (V):
(WOR+ 0.4)(18.948- 2.499V)
Y= (5-224)
(M+1.137-0.8094V)f'V'
where f(V) = -0.6891 + 0.9735V + 1.6453V
These equations are valid for mobility ratios ranging from 0 to 10 and for
permeability variations ranging from 0.3 to 0.8.
Based on calculations of WOR vs. oil recovery for a 5-spot pattern, Craig [298]
found that there was a minimum number of equal thickness layers required to
obtain the same performance as with 100 layers. Table 5-42 shows the effect of
permeability variation and mobility ratio on the minimum number of layers for
WORs above 10. Craig [298] presented similar tables for lower WORs.