Page 319 - Standard Handbook Petroleum Natural Gas Engineering VOLUME2
P. 319

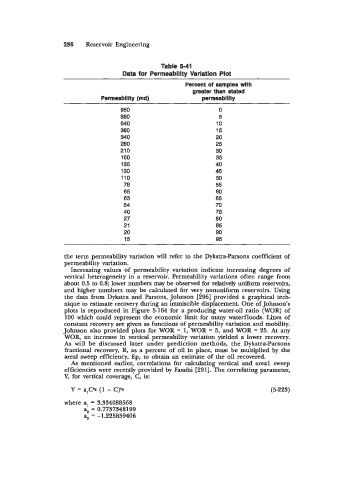
286    Reservoir Engineering


                                                 Table 5-41
                                      Data for Permeabilitv Variation Plot
                                                        Percent of samples with
                                                          greater than stated
                               Permeability (md)             Permeability
                                     950                          0
                                     860                          5
                                     640                         10
                                     380                         15
                                     340                         20
                                     280                         25
                                     21  0                       30
                                     160                         35
                                     135                         40
                                     130                         45
                                     110                         50
                                      78                         55
                                      65                         60
                                      63                         65
                                      54                         70
                                      40                         75
                                      27                         80
                                      21                         85
                                      20                         90
                                      15                         95

                    the term permeability variation will refer to the Dykstra-Parsons coefficient of
                    permeability variation.
                      Increasing values  of  permeability variation indicate increasing degrees  of
                    vertical heterogeneity in  a reservoir. Permeability variations often range from
                    about 0.5 to 0.8; lower numbers may be observed for relatively uniform reservoirs,
                    and higher numbers may  be  calculated for very nonuniform reservoirs. Using
                    the  data from Dykstra and Parsons, Johnson  [296] provided  a graphical tech-
                    nique to estimate recovery during an immiscible displacement. One of Johnson’s
                    plots is  reproduced in Figure 5-164 for a producing water-oil ratio  (WOR) of
                    100 which could represent the  economic limit for many waterfloods. Lines of
                    constant recovery are given as functions of permeability variation and mobility.
                    Johnson  also provided plots for WOR  = 1, WOR  = 5, and WOR  = 25. At  any
                    WOR,  an  increase in vertical permeability variation yielded  a lower recovery.
                    As  will  be  discussed  later  under  prediction  methods,  the  Dykstra-Parsons
                    fractional recovery, R,  as a percent of  oil in place, must be  multiplied by  the
                    areal sweep efficiency, Ep,  to obtain an estimate of the oil recovered.
                      As  mentioned earlier, correlations for  calculating vertical and areal  sweep
                    efficiencies were recently provided by Fassihi [291]. The correlating parameter,
                    Y, for vertical coverage, C, is:

                      Y = a,Ct (1 - C)%                                           (5-223)
                    where a,  = 3.334088568
                            = 0.7737348199
                              -1.225859406
   314   315   316   317   318   319   320   321   322   323   324