
Page 318 - Standard Handbook Petroleum Natural Gas Engineering VOLUME2
P. 318
Fluid Movement in Waterflooded Reservoirs 285
I .o C
0.8
0.6
0.4
I /
/
0.2 - - /
/
/
/
/
' /
\/
0 I I I I I I I I I D
0 0.2 0.4 0.6 0.8 I .o
FRACTION OF TOTAL VOLUME (h#)
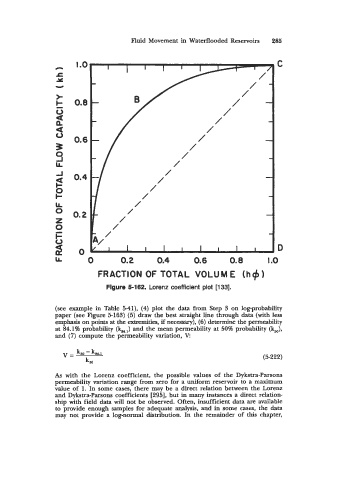
Figure 5-162. Lorenz coefficient plot [133].
(see example in Table 5-41), (4) plot the data from Step 3 on log-probability
paper (see Figure 5-163) (5) draw the best straight line through data (with less
emphasis on points at the extremities, if necessary), (6) determine the permeability
at 84.1% probability (kM,l) and the mean permeability at 50% probability (kJ,
and (7) compute the permeability variation, V:
(5-222)
As with the Lorenz coefficient, the possible values of the Dykstra-Parsons
permeability variation range from zero for a uniform reservoir to a maximum
value of 1. In some cases, there may be a direct relation between the Lorenz
and Dykstra-Parsons coefficients [295], but in many instances a direct relation-
ship with field data will not be observed. Often, insufficient data are available
to provide enough samples for adequate analysis, and in some cases, the data
may not provide a log-normal distribution. In the remainder of this chapter,