
Page 405 - Standard Handbook Petroleum Natural Gas Engineering VOLUME2
P. 405
Properties of Hydrocarbon Mixtures 371
-
1000 t
f ! \
- &Bubble point curve
200. I L
3 9 15
Volume cuft/lb. mol.
(a)
9'- GAS
Temperature -
point
(b)
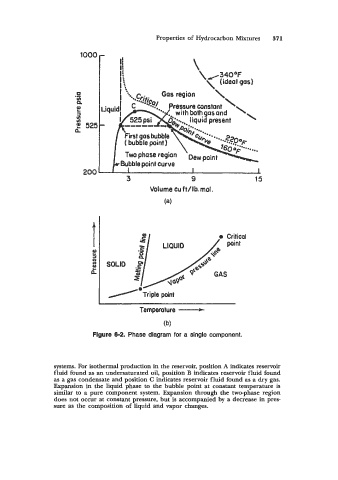
Figure 6-2. Phase diagram for a single component.
systems. For isothermal production in the reservoir, position A indicates reservoir
fluid found as an undersaturated oil, position B indicates reservoir fluid found
as a gas condensate and position C indicates reservoir fluid found as a dry gas.
Expansion in the liquid phase to the bubble point at constant temperature is
similar to a pure component system. Expansion through the two-phase region
does not occur at constant pressure, but is accompanied by a decrease in pres-
sure as the composition of liquid and vapor changes.