
Page 280 - Statistics II for Dummies
P. 280
264 Part IV: Building Strong Connections with Chi-Square Tests
Finding the Goodness-of-Fit Statistic
The general idea of a goodness-of-fit procedure involves determining what
you expect to find and comparing it to what you actually observe in your
own sample through the use of a test statistic. This test statistic is called the
goodness-of-fit test statistic because it measures how well your model (what
you expected) fits your actual data (what you observed).
In this section, you see how to figure out the numbers that you should
expect in each category given your proposed model, and you also see how
to put those expected values together with your observed values to form the
goodness-of-fit test statistic.
What’s observed versus what’s expected
For an example of something that can be observed versus what’s expected,
look no further than a bag of tasty M&M’S Milk Chocolate Candies. A ton of
different kinds of M&M’S are out there, and each kind has its own variation
of colors and tastes. For this study, any reference I give to M&M’S is to the
original milk chocolate candy — my favorite.
The percentage of each color of M&M’S that appear in a bag is something
Mars (the company that makes M&M’S) spends a lot of time thinking about.
Mars wants specific percentages of each color in its M&M’S bags, which
it determines through comprehensive marketing research based on what
people like and want to see. Mars then posts its current percentages for each
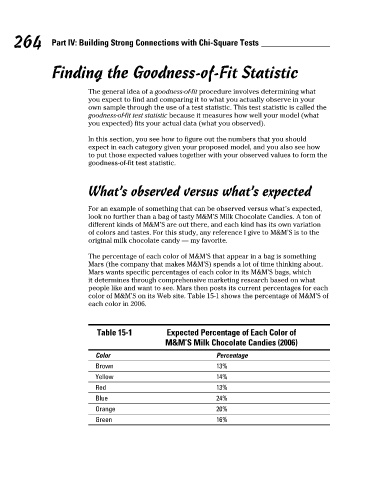
color of M&M’S on its Web site. Table 15-1 shows the percentage of M&M’S of
each color in 2006.
Table 15-1 Expected Percentage of Each Color of
M&M’S Milk Chocolate Candies (2006)
Color Percentage
Brown 13%
Yellow 14%
Red 13%
Blue 24%
Orange 20%
Green 16%
22_466469-ch15.indd 264 7/24/09 9:52:20 AM