
Page 281 - Statistics II for Dummies
P. 281
Chapter 15: Using Chi-Square Tests for Goodness-of-Fit 265
Now that you know what to expect from a bag of M&M’S, the next question is,
how does Mars deliver? If you were to open a bag of M&M’S right now, would
you get the percentages of each color that you’re supposed to get? You know
from your previous studies in statistics that sample results vary (for a quick
review of this idea, see Chapter 3). So you can’t expect each bag of M&M’S
to have exactly the correct number of each color of M&M’S as listed in Table
15-1. However, in order to keep customers happy, Mars should get close to
the expectations. How can you determine how close the company does get?
Table 15-1 tells you what percentages are expected to fall into each category
in the entire population of all M&M’S (that means every single M&M’S Milk
Chocolate Candy that’s currently being made). This set of percentages is
called the expected model for the data. You want to see whether the percentages
in the expected model are actually occurring in the packages you buy. To
start this process, you can take a sample of M&M’S (after all, you can’t check
every single one in the population) and make a table showing what percentage
of each color you observe. Then you can compare this table of observed
percentages to the expected model.
Some expected percentages are known, as they are for the M&M’S, or you can
figure them out by using math techniques. For example, if you’re examining a
single die to determine whether or not it’s a fair die, you know
that if the die is fair, you should expect of the outcomes to fall into each
category of 1, 2, 3, 4, 5, and 6.
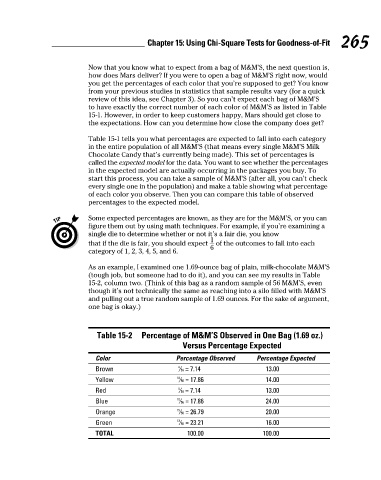
As an example, I examined one 1.69-ounce bag of plain, milk-chocolate M&M’S
(tough job, but someone had to do it), and you can see my results in Table
15-2, column two. (Think of this bag as a random sample of 56 M&M’S, even
though it’s not technically the same as reaching into a silo filled with M&M’S
and pulling out a true random sample of 1.69 ounces. For the sake of argument,
one bag is okay.)
Table 15-2 Percentage of M&M’S Observed in One Bag (1.69 oz.)
Versus Percentage Expected
Color Percentage Observed Percentage Expected
Brown 4 ⁄56 = 7.14 13.00
Yellow 10 ⁄56 = 17.86 14.00
Red 4 ⁄56 = 7.14 13.00
Blue 10 ⁄56 = 17.86 24.00
Orange 15 ⁄56 = 26.79 20.00
Green 13 ⁄56 = 23.21 16.00
TOTAL 100.00 100.00
22_466469-ch15.indd 265 7/24/09 9:52:20 AM