
Page 285 - Statistics II for Dummies
P. 285
Chapter 15: Using Chi-Square Tests for Goodness-of-Fit 269
reject the model. (What constitutes a large or small value of a Chi-square test
statistic depends on the degrees of freedom.)
The goodness-of-fit statistic follows the main characteristics of the Chi-square
distribution. The smallest-possible value of the goodness-of-fit statistic is
zero. Continuing the example from the previous section, if the M&M’S in my
sample followed the exact percentages found in Table 15-1, the goodness-of-fit
statistic would be zero. That’s because the observed counts and the expected
counts would be the same, so the values of the observed cell count minus the
expected cell count would all be zero.
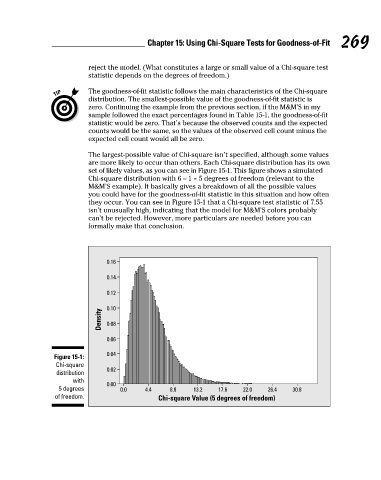
The largest-possible value of Chi-square isn’t specified, although some values
are more likely to occur than others. Each Chi-square distribution has its own
set of likely values, as you can see in Figure 15-1. This figure shows a simulated
Chi-square distribution with 6 – 1 = 5 degrees of freedom (relevant to the
M&M’S example). It basically gives a breakdown of all the possible values
you could have for the goodness-of-fit statistic in this situation and how often
they occur. You can see in Figure 15-1 that a Chi-square test statistic of 7.55
isn’t unusually high, indicating that the model for M&M’S colors probably
can’t be rejected. However, more particulars are needed before you can
formally make that conclusion.
0.16
0.14
0.12
0.10
Density 0.08
0.06
0.04
Figure 15-1:
Chi-square
0.02
distribution
with
0.00
5 degrees 0.0 4.4 8.8 13.2 17.6 22.0 26.4 30.8
of freedom. Chi-square Value (5 degrees of freedom)
22_466469-ch15.indd 269 7/24/09 9:52:21 AM