
Page 187 - Statistics and Data Analysis in Geology
P. 187
Statistics and Data Analysis in Geology
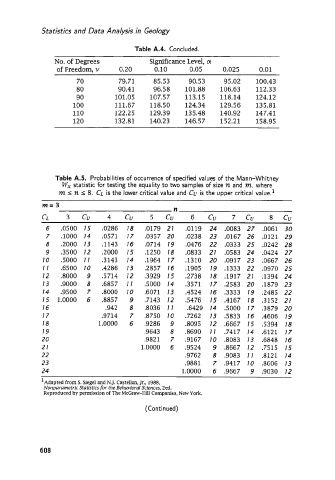
Table A.4. Concluded.
No. of Degrees Significance Level, cx
of Freedom, v 0.20 0.10 0.05 0.02 5 0.01
70 79.71 85.53 90.5 3 95.02 100.43
80 90.41 96.58 101.88 106.63 112.33
90 101.05 107.57 113.15 118.14 124.12
100 111.67 118.50 124.34 129.56 135.81
110 122.25 129.39 135.48 140.92 147.41
120 132.81 140.23 146.57 152.21 158.95
Table A.5. Probabilities of occurrence of specified values of the Mann-Whitney
W, statistic for testing the equality to two samples of size n and m, where
m 5 n I 8. CL is the lower critical value and Cu is the upper critical value.'
m=3 n
CL 3 cu 4 cu 5 Cu 6 Cu 7 Cu 8 Cu
6 .0500 15 .0286 18 .0179 21 .0119 24 .0083 27 .0061 30
7 .lo00 14 .0571 17 .0357 20 .0238 23 .0167 26 .0121 29
8 .2000 13 ,1143 16 .0714 19 .0476 22 .0333 25 .0242 28
9 .3500 12 .zoo0 15 .1250 18 ,0833 21 .0583 24 .0424 27
10 .5000 11 .3143 14 .1964 17 .1310 20 .0917 23 .0667 26
11 .6500 10 .4286 13 .2857 16 .1905 19 .1333 22 .0970 25
12 .8000 9 .5714 12 .3929 15 .2738 18 .1917 21 .1394 24
13 .9000 8 .6857 11 .5000 14 .3571 17 .2583 20 .1879 23
14 .9500 7 ,8000 10 .6071 13 .4524 16 ,3333 19 .2485 22
15 1.0000 6 .8857 9 .7143 12 S476 15 .4167 18 ,3152 21
16 .942 8 .8036 11 .6429 14 .5000 17 .3879 20
17 .9714 7 .8750 10 .7262 13 .5833 16 .4606 19
18 1.0000 6 .9286 9 .8095 12 .6667 15 .5394 18
19 .9643 8 .8690 11 .7417 14 .6121 17
20 .982 1 7 .9167 10 .8083 13 .6848 16
21 1.0000 6 .9524 9 .8667 12 .7515 15
22 .9762 8 .9083 11 .8121 14
23 .9881 7 .94 17 10 .8606 13
24 1.0000 6 .9667 9 .9030 12
'Adapted from S. Siege1 and N.J. Castellan, Jr., 1988,
Nonparametric Statistics for the Behavioral Sciences, Zed.
Reproduced by permission of The McGraw-Hill Companies, New York.
(Con tin ued)
608