
Page 182 - Statistics and Data Analysis in Geology
P. 182
Appendix
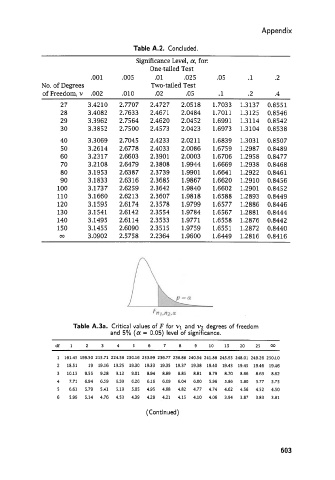
Table A.2. Concluded.
Sigdicance Level, a, for:
One-tailed Test
.001 .005 .01 .025 .05 .1 .2
No. of Degrees Two-tailed Test
of Freedom, v ,002 ,010 .02 .05 .1 .2 .4
27 3.4210 2.7707 2.4727 2.0518 1.7033 1.3137 0.8551
28 3.4082 2.7633 2.4671 2.0484 1.7011 1.3125 0.8546
29 3.3962 2.7564 2.4620 2.0452 1.6991 1.3114 0.8542
30 3.3852 2.7500 2.4573 2.0423 1.6973 1.3104 0.8538
40 3.3069 2.7045 2.4233 2.02 11 1.6839 1.3031 0.8507
50 3.2614 2.6778 2.4033 2.0086 1.6759 1.2987 0.8489
60 3.2317 2.6603 2.3901 2.0003 1.6706 1.2958 0.8477
70 3.2108 2.6479 2.3808 1.9944 1.6669 1.2938 0.8468
80 3.1953 2.6387 2.3739 1.9901 1.664 1 1.2922 0.8461
90 3.1833 2.6316 2.3685 1.9867 1.6620 1.2910 0.8456
100 3.1737 2.6259 2.3642 1.9840 1.6602 1.2901 0.8452
110 3.1660 2.6213 2.3607 1.9818 1.6588 1.2893 0.8449
120 3.1595 2.6174 2.3578 1.9799 1.6577 1.2886 0.8446
130 3.1541 2.6142 2.3554 1.9784 1.6567 1.2881 0.8444
140 3.1495 2.61 14 2.3533 1.9771 1.6558 1.2876 0.8442
150 3.1455 2.6090 2.3515 1.9759 1.6551 1.2872 0.8440
03 3.0902 2.5758 2.2364 1.9600 1.6449 1.2816 0.8416
Table A.3a. Critical values of F for v1 and vz degrees of freedom
and 5% (a = 0.05) level of significance.
df1 2 3 4 5 6 7 8 9 1 0 1 5 2 0 2 5 0 0
1 161.45 199.50 215.71 224.58 230.16 233.99 236.77 238.88 240.54 241.88 245.95 248.01 249.26 250.10
2 18.51 19 19.16 19.25 19.30 19.33 19.35 19.37 19.38 19.40 19.43 19.45 19.46 19.46
3 10.13 9.55 9.28 9.12 9.01 8.94 8.89 8.85 8.81 8.79 8.70 8.66 8.63 8.62
4 7.71 6.94 6.59 6.39 6.26 6.16 6.09 6.04 6.00 5.96 5.86 5.80 5.77 5.75
5 6.61 5.79 5.41 5.19 5.05 4.95 4.88 4.82 4.77 4.74 4.62 4.56 4.52 4.50
6 5.99 5.14 4.76 4.53 4.39 4.28 4.21 4.15 4.10 4.06 3.94 3.87 3.83 3.81
(Continued)
603