
Page 181 - Statistics and Data Analysis in Geology
P. 181
Statistics and Data Analysis in Geology
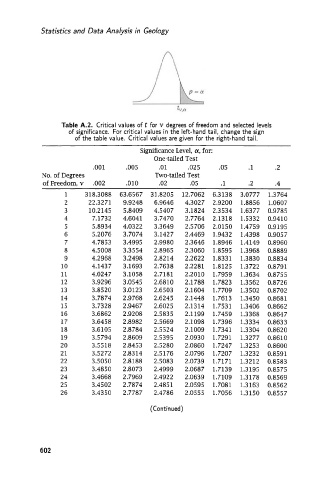
Table A.2. Critical values of t for v degrees of freedom and selected levels
of significance. For critical values in the left-hand tail, change the sign
of the table value. Critical values are given for the right-hand tail.
Significance Level, a, for:
One-tailed Test
.001 .005 .01 .025 .05 .1 .2
No. of Degrees Two-tailed Test
of Freedom, v .002 .010 .02 .05 .1 .2 .4
1 3 18.3088 63.6567 31.8205 12.7062 6.3138 3.0777 1.3764
2 22.3271 9.9248 6.9646 4.3027 2.9200 1.8856 1.0607
3 10.2 145 5.8409 4.5407 3.1824 2.3534 1.6377 0.9785
4 7.1732 4.6041 3.7470 2.7764 2.1318 1.5332 0.9410
5 5.8934 4.0322 3.3649 2.5706 2.0150 1.4759 0,9195
6 5.2076 3.7074 3.1427 2.4469 1.9432 1.4398 0.9057
7 4.7853 3.4995 2.9980 2.3646 1.8946 1.4149 0.8960
8 4.5008 3.3554 2.8965 2.3060 1.8595 1.3968 0.8889
9 4.2968 3.2498 2.8214 2.2622 1.8331 1.3830 0.8834
10 4.1437 3.1693 2.7638 2.2281 1.8125 1.3722 0.8791
11 4.0247 3.1058 2.7181 2.2010 1.7959 1.3634 0.8755
12 3.9296 3.0545 2.6810 2.1788 1.7823 1.3562 0.8726
13 3.8520 3.0123 2.6503 2.1604 1.7709 1.3502 0.8702
14 3.7874 2.9768 2.6245 2.1448 1.7613 1.3450 0.8681
15 3.7328 2.9467 2.6025 2.1314 1.7531 1.3406 0.8662
16 3.6862 2.9208 2.5835 2.1 199 1.7459 1.3368 0.8647
17 3.6458 2.8982 2.5669 2.1098 1.7396 1.3334 0.8633
18 3.6105 2.8784 2.5524 2.1009 1.7341 1.3304 0.8620
19 3.5794 2.8609 2.5395 2.0930 1.7291 1.3277 0.8610
20 3.5518 2.8453 2.5280 2.0860 1.7247 1.3253 0.8600
21 3.5272 2.8314 2.5176 2.0796 1.7207 1.3232 0.8591
22 3.5050 2.8188 2.5083 2.0739 1.7171 1.3212 0.8583
23 3.4850 2.8073 2.4999 2.0687 1.7139 1.3195 0.8575
24 3.4668 2.7969 2.4922 2.0639 1.7109 1.3178 0.8569
25 3.4502 2.7874 2.4851 2.0595 1.7081 1.3163 0.8562
26 3.4350 2.7787 2.4786 2.0555 1.7056 1.3150 0.8557
(Continued)
602