
Page 179 - Statistics and Data Analysis in Geology
P. 179
Next Page
Statistics and Data Analysis in Geology - Chapter 6
A B C D E F
U
-0.5
-1 .o a
A B C D E F
1 .o U T I
-0.5
-1 .o b
A B C D E F
-0.5
-1 .o C
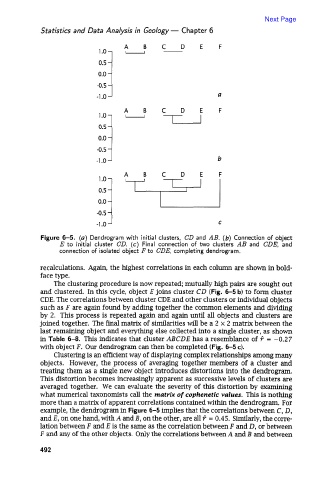
Figure 6-5. (a) Dendrogram with initial clusters, CD and AB. (b) Connection of object
E to initial cluster CD. (c) Final connection of two clusters AB and CDE, and
connection of isolated object F to CDE, completing dendrogram.
recalculations. Again, the highest correlations in each column are shown in bold-
face type.
The clustering procedure is now repeated; mutually high pairs are sought out
and clustered. In this cycle, object E joins cluster CD (Fig. 6-5 b) to form cluster
CDE. The correlations between cluster CDE and other clusters or individual objects
such as F are again found by adding together the common elements and dividing
by 2. This process is repeated again and again until all objects and clusters are
joined together. The final matrix of similarities will be a 2 x 2 matrix between the
last remaining object and everything else collected into a single cluster, as shown
in Table 6-8. This indicates that cluster ABCDE has a resemblance of? = -0.27
with object F. Our dendrogram can then be completed (Fig. 6-5 c).
Clustering is an efficient way of displaying complex relationships among many
objects. However, the process of averaging together members of a cluster and
treating them as a single new object introduces distortions into the dendrogram.
This distortion becomes increasingly apparent as successive levels of clusters are
averaged together. We can evaluate the severity of this distortion by examining
what numerical taxonomists call the matrix of cophenetic values. This is nothing
more than a matrix of apparent correlations contained within the dendrogram. For
example, the dendrogram in Figure 6-5 implies that the correlations between C, D,
and E, on one hand, with A and B, on the other, are all ? = 0.45. Similarly, the corre-
lation between F and E is the same as the correlation between F and D, or between
F and any of the other objects. Only the correlations between A and B and between
492