
Page 196 - Statistics and Data Analysis in Geology
P. 196
Appendix
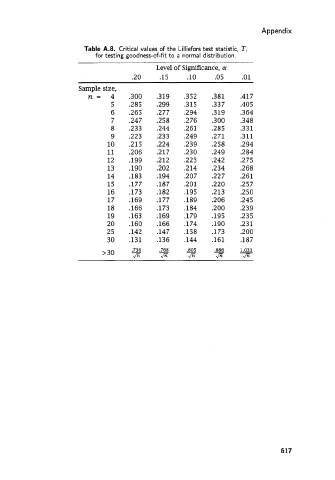
Table A.8. Critical values of the Lilliefors test statistic, T,
for testing goodness-of-fit to a normal distribution.
Level of Significance, a
.20 .15 .10 .05 .01
Sample size,
n= 4 .300 .319 .352 .381 .417
5 ,285 .299 .315 .337 .405
6 .265 .277 .294 .319 .364
7 .247 ,258 .276 .300 .348
8 .233 ,244 .261 .285 .331
9 .223 .233 .249 .271 .311
10 .215 ,224 ,239 .258 .294
11 .206 .217 .230 .249 ,284
12 .199 .212 ,223 .242 .275
13 ,190 .202 .214 .234 .268
14 .183 .194 .207 .227 .261
15 .177 .187 .201 .220 .257
16 .173 ,182 .195 .213 .250
17 .169 .177 .189 .206 ,245
18 .166 .173 .184 .200 .239
19 .163 .169 .179 .195 .235
20 .160 ,166 .174 .190 .231
25 .142 ,147 .158 .173 .200
30 .131 .136 .144 .161 .187
.736
1.031
.886
.768
>30 - - A05 - -
fi
fi
fi
fi
fi
617