
Page 198 - Statistics and Data Analysis in Geology
P. 198
Appendix
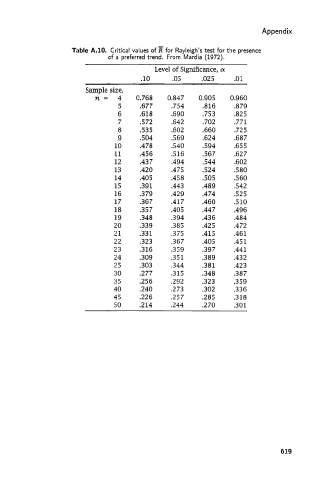
Table A.10. Critical values of for Rayleigh's test for the presence
of a preferred trend. From Mardia (1972).
Level of Significance, a
.10 .05 ,025 .01
~~ ~
Sample size,
n= 4 0.768 0.847 0.905 0.960
5 .677 .754 .816 .879
6 .618 .690 .753 .825
7 .572 .642 ,702 .771
8 .535 .602 ,660 .725
9 .504 .569 .624 .687
10 .4 78 .540 ,594 .655
11 .456 .516 .567 .62 7
12 .437 .494 ,544 .602
13 .420 .475 .524 .580
14 .405 .458 .SO5 .560
15 .391 .443 .489 .542
16 .379 .429 .474 .525
17 .367 .417 .460 .510
18 .357 .405 ,447 .496
19 .348 .394 .436 .484
20 .339 .385 .425 .472
21 .331 .375 ,415 .461
22 .323 .367 .405 .451
23 ,316 .359 ,397 .44 1
24 ,309 .351 .389 .432
25 .303 .344 .381 .423
30 .277 .315 .348 .387
35 .256 .292 .323 .359
40 .240 .273 ,302 .336
45 .226 .257 .285 .318
50 .214 .244 .270 .301
619