
Page 199 - Statistics and Data Analysis in Geology
P. 199
Statistics and Data Analysis in Geology
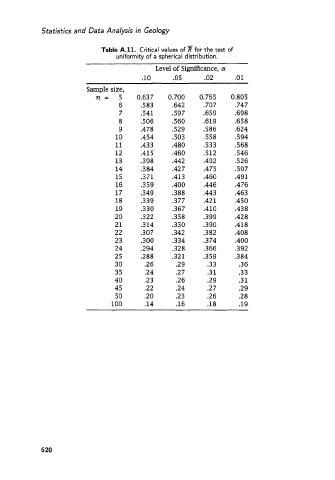
Table A.11. Critical values of for the test of
uniformity of a spherical distribution.
Level of Significance, a
.10 .05 .02 .o 1
Sample size,
n= 5 0.637 0.700 0.765 0.805
6 .583 .642 .707 .747
7 .541 .597 .659 .698
8 .SO6 ,560 .619 .658
9 .478 .529 .586 .624
10 .454 .SO3 .558 .594
11 .433 .480 .533 ,568
12 .415 .460 .512 .546
13 .398 .442 .492 .526
14 .384 .427 .475 .507
15 .371 .413 .460 .491
16 .359 .400 ,446 .4 76
17 .349 .388 .443 ,463
18 .339 .377 .42 1 ,450
19 .330 ,367 .410 .438
20 .322 .358 .399 .428
21 .314 .350 .390 ,418
22 .307 .342 .382 .408
23 .300 .334 .374 .400
24 .294 .328 ,366 .392
25 .288 .321 .359 .384
30 .26 .29 .33 .36
35 .24 .27 .31 .33
40 .23 .26 .29 .3 1
45 .22 .24 .27 .29
50 .20 .23 .26 .28
100 .14 .16 .18 .19
620