
Page 197 - Statistics and Data Analysis in Geology
P. 197
Statistics and Data Analysis, in Geology
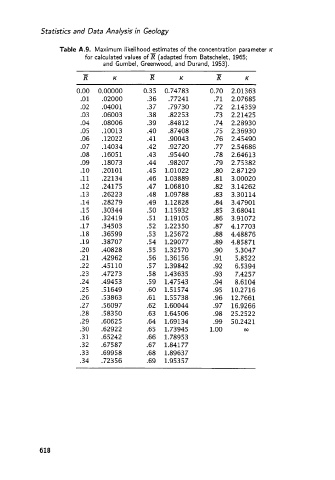
Table A.9. Maximum likelihood estimates of the concentration parameter K
for calculated values of a (adapted from Batschelet, 1965;
and Gumbel, Greenwood, and Durand, 1953).
-
i? K i? K R K
0.00 0.00000 0.35 0.74783 0.70 2.01363
.01 .02000 .36 .77241 .71 2.07685
.02 .04001 .37 .79730 -72 2.14359
.03 .06003 -38 .82253 .73 2.21425
.04 .08006 .39 .84812 -74 2.28930
.05 .lo013 .40 .87408 .75 2.36930
.06 .12022 .4 1 .go043 -76 2.45490
.07 .14034 .42 .92720 -77 2.54686
.08 .16051 .43 .95440 .78 2.64613
.09 .18073 .44 ,98207 .79 2.75382
.10 .20101 .4 5 1.01022 .80 2.87129
.ll .22134 .46 1.03889 .81 3.00020
.12 .24175 .4 7 1.068 10 .82 3.14262
.13 .26223 .48 1.09788 .83 3.30114
.14 .28279 .49 1.12828 .84 3.47901
.15 .30344 .so 1.15932 .85 3.68041
.16 ,32419 .51 1.19105 .86 3.91072
.17 .34503 .52 1.22350 .87 4.17703
.18 .36599 .53 1.25672 .88 4.48876
.19 .38707 .54 1.29077 .89 4.85871
.20 .40828 .55 1.32570 .90 5.3047
.21 .42962 .56 1.36156 .91 5.8522
.22 .45110 .57 1.39842 -92 6.5394
.23 .47273 .58 1.43635 .93 7.4257
.24 .49453 .59 1.47543 .94 8.6104
25 .51649 .60 1.51574 .95 10.2716
.26 .53863 -61 1.55738 .96 12.766 1
.27 .56097 .62 1.60044 .97 16.9266
.28 .58350 .63 1.64 506 .98 25.2522
29 .60625 -64 1.69134 .99 50.2421
.30 .62922 .65 1.73945 1.00 CQ
.31 .65242 .66 1.7895 3
.32 .67587 .67 1.841 77
.33 .69958 .68 1.89637
.34 .72356 .69 1.95357
618