
Page 31 - Statistics and Data Analysis in Geology
P. 31
Statistics and Data Analysis in Geology - Chapter 2
Number of holes drilled
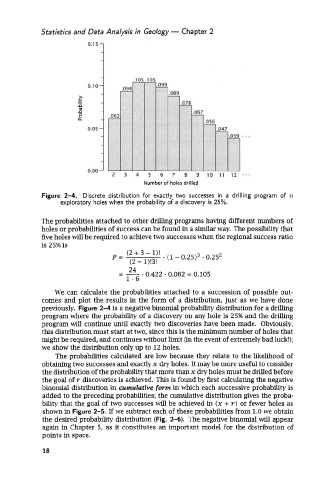
Figure 2-4. Discrete distribution for exactly two successes in a drilling program of n
exploratory holes when the probability of a discovery is 25%.
The probabilities attached to other drilling programs having different numbers of
holes or probabilities of success can be found in a similar way. The possibility that
five holes will be required to achieve two successes when the regional success ratio
is 25% is
(2 + 3 - l)!
P= - (1 - 0.25)3 * 0.2S2
(2 - 1)!3!
- 0.422 - 0.062 = 0.105
--. 24
1.6
We can calculate the probabilities attached to a succession of possible out-
comes and plot the results in the form of a distribution, just as we have done
previously. Figure 2-4 is a negative binomial probability distribution for a drilling
program where the probability of a discovery on any hole is 25% and the drilling
program will continue until exactly two discoveries have been made. Obviously,
this distribution must start at two, since this is the minimum number of holes that
might be required, and continues without limit (in the event of extremely bad luck!);
we show the distribution only up to 12 holes.
The probabilities calculated are low because they relate to the likelihood of
obtaining two successes and exactly x dry holes. It may be more useful to consider
the distribution of the probability that more than x dry holes must be drilled before
the goal of Y discoveries is achieved. This is found by first calculating the negative
binomial distribution in cumulative form in which each successive probability is
added to the preceding probabilities; the cumulative distribution gives the proba-
bility that the goal of two successes will be achieved in (x + Y) or fewer holes as
shown in Figure 2-5. If we subtract each of these probabilities from 1.0 we obtain
the desired probability distribution (Fig. 2-6). The negative binomial will appear
again in Chapter 5, as it constitutes an important model for the distribution of
points in space.
18