
Page 27 - Statistics and Data Analysis in Geology
P. 27
Statistics and Data Analysis in Geology - Chapter 2
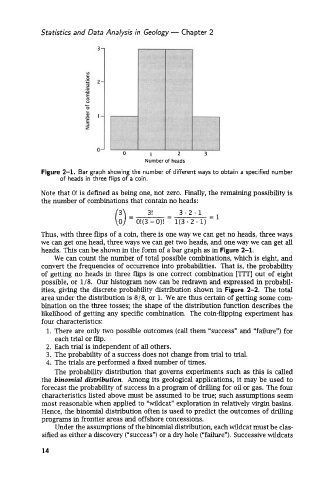
Figure 2-1. Bar graph showing the number of different ways to obtain a specified number
of heads in three flips of a coin.
Note that O! is defined as being one, not zero. Finally, the remaining possibility is
the number of combinations that contain no heads:
3! - 3.2.1
-
(3 = 0!(3 - O)! l(3 - 2 . 1) =1
Thus, with three flips of a coin, there is one way we can get no heads, three ways
we can get one head, three ways we can get two heads, and one way we can get all
heads. This can be shown in the form of a bar graph as in Figure 2-1.
We can count the number of total possible combinations, which is eight, and
convert the frequencies of occurrence into probabilities. That is, the probability
of getting no heads in three flips is one correct combination [TTT] out of eight
possible, or 1/8. Our histogram now can be redrawn and expressed in probabil-
ities, giving the discrete probability distribution shown in Figure 2-2. The total
area under the distribution is 8/8, or 1. We are thus certain of getting some com-
bination on the three tosses; the shape of the distribution function describes the
likelihood of getting any specific combination. The coin-flipping experiment has
four characteristics:
1. There are only two possible outcomes (call them “success” and “failure”) for
each trial or flip.
2. Each trial is independent of all others.
3. The probability of a success does not change from trial to trial.
4. The trials are performed a fixed number of times.
The probability distribution that governs experiments such as this is called
the binomial distribution. Among its geological applications, it may be used to
forecast the probability of success in a program of drilling for oil or gas. The four
characteristics listed above must be assumed to be true; such assumptions seem
most reasonable when applied to “wildcat” exploration in relatively virgin basins.
Hence, the binomial distribution often is used to predict the outcomes of drilling
programs in frontier areas and offshore concessions.
Under the assumptions of the binomial distribution, each wildcat must be clas-
sified as either a discovery (“success”) or a dry hole (“failure”). Successive wildcats
14