
Page 54 - Statistics and Data Analysis in Geology
P. 54
Statistics and Data Analysis in Geology - Chapter 3
Similarly, the change in production can be found by subtracting:
B - A - D
-
84 102 4 105 63 5 -21 39 -1
240 121 1 - 218 80 2 =
[ 302 28 O] [ 220 76 I] [ ii -:; I:]
Note that A was subtracted from B simply to show increases in production as pos-
itive values.
As in ordinary algebra, A + B = B + A, and (A + B) + C = A + (B + C), provided
all are n x m matrices. The order of subtraction is, of course, mandatory.
Transposition is a matrix operation in which rows become columns and col-
umns become rows. Each element Xij becomes the element xji in the transpose.
The operation is indicated symbolically by XT or by X’. So,
Note that the first row has become the first column of the transpose, and the second
row has become the second column. In some of the calculations we will consider
later, a row vector, A, becomes a column vector, AT, when transposed, and vice
versa. The row and column vectors
are the transpose of each other.
A matrix may be multiplied by R constunt by multiplying each element in the
[: :] [n ::]
matrix by the constant. For example
3~ 2 5 = 6 15
Strictly speaking, a matrix cannot be divided by a constant, but we can perform
an equivalent operation. If we multiply a matrix by a value equal to the inverse of a
constant, we obtain the same numerical result as if we divided each element of the
matrix by the constant. The inverse of the constant, c, is indicated by c-l, which
represents llc.
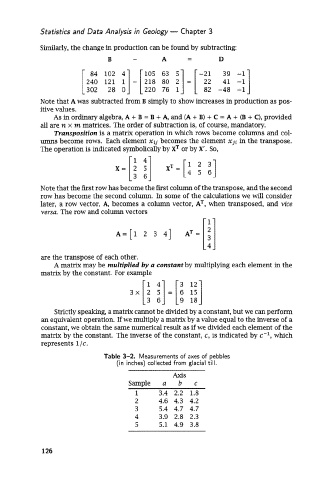
Table 3-2. Measurements of axes of pebbles
(in inches) collected from glacial till.
AXiS
Sample a b c
1 3.4 2.2 1.8
2 4.6 4.3 4.2
3 5.4 4.7 4.7
4 3.9 2.8 2.3
5 5.1 4.9 3.8
126