
Page 50 - Statistics and Data Analysis in Geology
P. 50
Next Page
Elementary Statistics
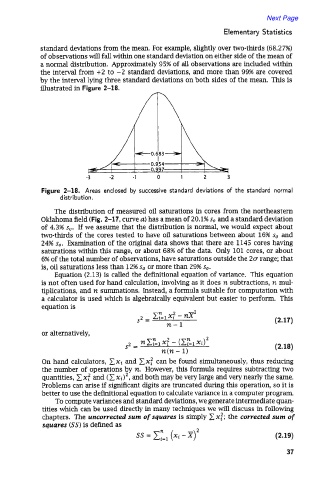
standard deviations from the mean. For example, slightly over two-thirds (68.27%)
of observations will fall within one standard deviation on either side of the mean of
a normal distribution. Approximately 95% of all observations are included within
the interval from +2 to -2 standard deviations, and more than 99% are covered
by the interval lying three standard deviations on both sides of the mean. This is
illustrated in Figure 2-18.
-0.683-
-3 -2 -1 0 1 2 3
Figure 2-18. Areas enclosed by successive standard deviations of the standard normal
distribution.
The distribution of measured oil saturations in cores from the northeastern
Oklahoma field (Fig. 2-17, curve u) has a mean of 20.1% so and a standard deviation
of 4.3% so. If we assume that the distribution is normal, we would expect about
two-thirds of the cores tested to have oil saturations between about 16% so and
24% so. Examination of the original data shows that there are 1145 cores having
saturations within this range, or about 68% of the data. Only 101 cores, or about
6% of the total number of observations, have saturations outside the 2a range; that
is, oil saturations less than 12% so or more than 29% so.
Equation (2.13) is called the definitional equation of variance. This equation
is not often used for hand calculation, involving as it does n subtractions, n mul-
tiplications, and n summations. Instead, a formula suitable for computation with
a calculator is used which is algebraically equivalent but easier to perform. This
equation is
(2.17)
or alternatively,
(2.18)
On hand calculators, Cxi and Ex: can be found simultaneously, thus reducing
the number of operations by n. However, this formula requires subtracting two
x;
quantities, 1 and (1 xi)2, and both may be very large and very nearly the same.
Problems can arise if significant digits are truncated during this operation, so it is
better to use the definitional equation to calculate variance in a computer program.
To compute variances and standard deviations, we generate intermediate quan-
tities which can be used directly in many techniques we will discuss in following
chapters. The uncorrected sum of squares is simply 2 x;; the corrected sum of
squures (SS) is defined as
2
ss= 1: t=l (Xi-X) (2.19)
37