
Page 47 - Statistics and Data Analysis in Geology
P. 47
Statistics and Data Analysis in Geology - Chapter 2
Summary Statistics
The most obvious measure of a population or sample is some type of average value.
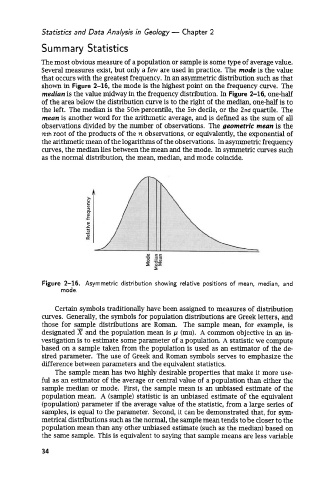
Several measures exist, but only a few are used in practice. The mode is the value
that occurs with the greatest frequency. In an asymmetric distribution such as that
shown in Figure 2-16, the mode is the highest point on the frequency curve. The
median is the value midway in the frequency distribution. In Figure 2-16, one-half
of the area below the distribution curve is to the right of the median, one-half is to
the left. The median is the 50th percentile, the 5th decile, or the 2nd quartile. The
meun is another word for the arithmetic average, and is defined as the sum of all
observations divided by the number of observations. The geometric meun is the
nth root of the products of the n observations, or equivalently, the exponential of
the arithmetic mean of the logarithms of the observations. In asymmetric frequency
curves, the median lies between the mean and the mode. In symmetric curves such
as the normal distribution, the mean, median, and mode coincide.
Figure 2-16. Asymmetric distribution showing relative positions of mean, median, and
mode.
Certain symbols traditionally have been assigned to measures of distribution
curves. Generally, the symbols for population distributions are Greek letters, and
those for sample distributions are Roman. The sample mean, for example, is
designated X and the population mean is p (mu). A common objective in an in-
vestigation is to estimate some parameter of a population. A statistic we compute
based on a sample taken from the population is used as an estimator of the de-
sired parameter. The use of Greek and Roman symbols serves to emphasize the
difference between parameters and the equivalent statistics.
The sample mean has two highly desirable properties that make it more use-
ful as an estimator of the average or central value of a population than either the
sample median or mode. First, the sample mean is an unbiased estimate of the
population mean. A (sample) statistic is an unbiased estimate of the equivalent
(population) parameter if the average value of the statistic, from a large series of
samples, is equal to the parameter. Second, it can be demonstrated that, for sym-
metrical distributions such as the normal, the sample mean tends to be closer to the
population mean than any other unbiased estimate (such as the median) based on
the same sample. This is equivalent to saying that sample means are less variable
34