
Page 43 - Statistics and Data Analysis in Geology
P. 43
Statistics and Data Analysis in Geology - Chapter 2
reproducible with repeated sampling. Unfortunately, such a histogram will contain
little detail and may not be particularly informative. Increasing the number of
categories reveals more details of the distribution, but because each category will
contain fewer observations, the histogram will be less stable. The choice of origin
for histogram categories also may influence the shape of the histogram. Interactive
software allows the user to dynamically vary the width of the histogram intervals
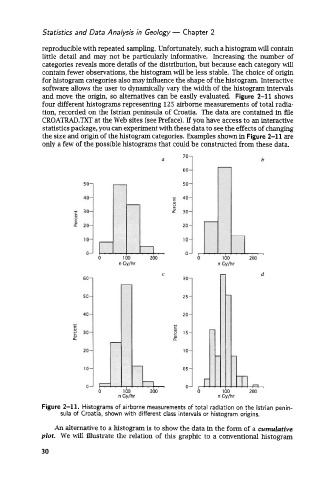
and move the origin, so alternatives can be easily evaluated. Figure 2-11 shows
four different histograms representing 125 airborne measurements of total radia-
tion, recorded on the Istrian peninsula of Croatia. The data are contained in file
CROATRAD.TXT at the Web sites (see Preface). If you have access to an interactive
statistics package, you can experiment with these data to see the effects of changing
the size and origin of the histogram categories. Examples shown in Figure 2-11 are
only a few of the possible histograms that could be constructed from these data.
Figure 2-11. Histograms of airborne measurements of total radiation on the lstrian penin-
sula of Croatia, shown with different class intervals or histogram origins.
An alternative to a histogram is to show the data in the form of a cumulative
plot. We will illustrate the relation of this graphic to a conventional histogram
30