
Page 48 - Statistics and Data Analysis in Geology
P. 48
Elementary Statistics
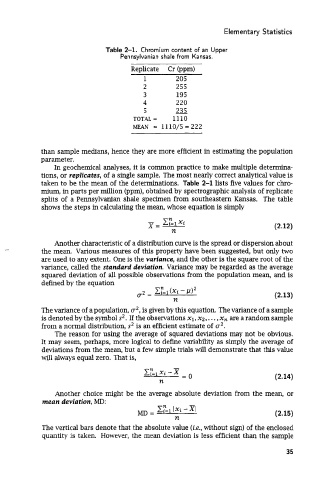
Table 2-1. Chromium content of an Upper
Pennsylvanian shale from Kansas.
Replicate Cr (ppm)
1 205
2 255
3 195
4 220
5 -
235
TOTAL= 1110
MEAN = 1110/5=222
than sample medians, hence they are more efficient in estimating the population
parameter.
In geochemical analyses, it is common practice to make multiple determina-
tions, or replicates, of a single sample. The most nearly correct analytical value is
taken to be the mean of the determinations. Table 2-1 lists five values for chro-
mium, in parts per million (ppm), obtained by spectrographic analysis of replicate
splits of a Pennsylvanian shale specimen from southeastern Kansas. The table
shows the steps in calculating the mean, whose equation is simply
(2.12)
Another characteristic of a distribution curve is the spread or dispersion about
_- the mean. Various measures of this property have been suggested, but only two
are used to any extent. One is the variance, and the other is the square root of the
variance, called the standard deviation. Variance may be regarded as the average
squared deviation of all possible observations from the population mean, and is
defined bv the eauation
(2.13)
n
The variance of a population, u2, is given by this equation. The variance of a sample
is denoted by the symbol s2. If the observations XI, XZ, . . . , xn are a random sample
from a normal distribution, s2 is an efficient estimate of u2.
The reason for using the average of squared deviations may not be obvious.
It may seem, perhaps, more logical to define variability as simply the average of
deviations from the mean, but a few simple trials will demonstrate that this value
will always equal zero. That is,
(2.14)
Another choice might be the average absolute deviation from the mean, or
mean deviation, MD: -
cz, 1% -XI
MD = (2.15)
n
The vertical bars denote that the absolute value (i.e., without sign) of the enclosed
quantity is taken. However, the mean deviation is less efficient than the sample
35