
Page 49 - Statistics and Data Analysis in Geology
P. 49
Statistics and Data Analysis in Geology - Chapter 2
variance. If we take repeated samples, the mean deviations will be more variable
than variances calculated from the same samples. Although not intuitively obvious,
the variance has properties that make it far more useful than other measures of
scatter.
Because variance is the average squared deviation from the mean, its units are
the square of the units of the original measurements. A granite, for example, may
have feldspar phenocrysts whose longest axes have an average length of 13.2 mm
and a variance of 2.0 mm2. Many people may find themselves reluctant to regard
areas as an appropriate measurement unit for the dispersion of lengths! Fortu-
nately, in most instances where we are concerned with variance, it is standardized
or converted to a form independent of the measurement units. This is a topic
discussed in greater detail elsewhere in this chapter.
To provide a statistic that describes dispersion or spread of data around the
mean, and is in the units of measurement of the data, we can calculate the standard
deviation. This is defined simply as the square root of variance and is symbolically
written as CT for the population parameter and s for the sample statistic. In equation
form,
(2.16)
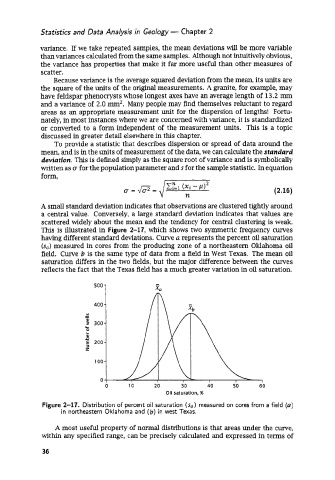
A small standard deviation indicates that observations are clustered tightly around
a central value. Conversely, a large standard deviation indicates that values are
scattered widely about the mean and the tendency for central clustering is weak.
This is illustrated in Figure 2-17, which shows two symmetric frequency curves
having different standard deviations. Curve u represents the percent oil saturation
(so) measured in cores from the producing zone of a northeastern Oklahoma oil
field. Curve b is the same type of data from a field in West Texas. The mean oil
saturation differs in the two fields, but the major difference between the curves
reflects the fact that the Texas field has a much greater variation in oil saturation.
500 1 P
Oil saturation, %
Figure 2-17. Distribution of percent oil saturation (so) measured on cores from a field (a)
in northeastern Oklahoma and (b) in west Texas.
A most useful property of normal distributions is that areas under the curve,
within any specified range, can be precisely calculated and expressed in terms of
36