
Page 45 - Statistics and Data Analysis in Geology
P. 45
Statistics and Data Analysis in Geology - Chapter 2
The great advantage of plotting data in cumulative form, however, comes about
because we can show the individual observations directly, and avoid the loss of res-
olution that comes from grouping the Observations into categories for a histogram.
To do this, we must first rank the observations from smallest to largest, divide each
observation's rank by the number of observations to convert it into a fraction, then
multiply by 100 to express it as a percentile. That is,
( ran ","' )
percentile of Xi = 100 (2.11)
xi
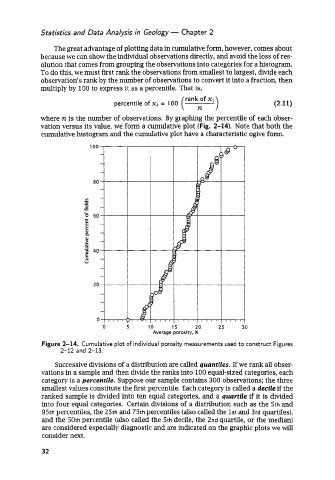
where n is the number of observations. By graphing the percentile of each obser-
vation versus its value, we form a cumulative plot (Fig. 2-14). Note that both the
cumulative histogram and the cumulative plot have a characteristic ogive form.
s
2ok
U
0
0
10 15 20 25 30
Average porosity, %
Figure 2-14. Cumulative plot of individual porosity measurements used to construct Figures
2-12 and 2-13.
Successive divisions of a distribution are called quantizes. If we rank all obser-
vations in a sample and then divide the ranks into 100 equal-sized categories, each
category is a percentile. Suppose our sample contains 300 observations; the three
smallest values constitute the first percentile. Each category is called a decile if the
ranked sample is divided into ten equal categories, and a quartile if it is divided
into four equal categories. Certain divisions of a distribution such as the 5th and
95th percentiles, the 25th and 75th percentiles (also called the 1st and 3rd quartiles),
and the 50th percentile (also called the 5th decile, the 2nd quartile, or the median)
are considered especially diagnostic and are indicated on the graphic plots we will
consider next.
32