
Page 44 - Statistics and Data Analysis in Geology
P. 44
Elementary Statistics
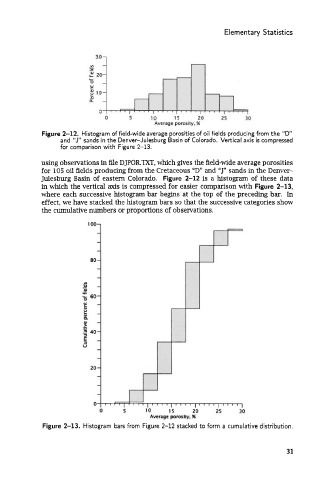
Figure 2-12. Histogram of field-wide average porosities of oil fields producing from the “D’
and “J” sands in the Denver-Julesburg Basin of Colorado. Vertical axis is compressed
for comparison with Figure 2-13.
using observations in file DJPOR.TXT, which gives the field-wide average porosities
for 105 oil fields producing from the Cretaceous “D” and “J” sands in the Denver-
Julesburg Basin of eastern Colorado. Figure 2-12 is a histogram of these data
in which the vertical axis is compressed for easier comparison with Figure 2-13,
where each successive histogram bar begins at the top of the preceding bar. In
effect, we have stacked the histogram bars so that the successive categories show
the cumulative numbers or proportions of observations.
Figure 2-13. Histogram bars from Figure 2-12 stacked to form a cumulative distribution.
31