
Page 46 - Statistics and Data Analysis in Geology
P. 46
Elementary Statistics
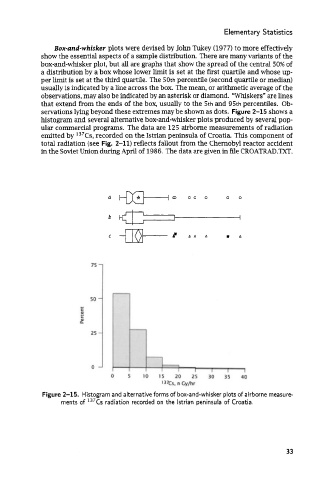
Box-and-whiskev plots were devised by John Tukey (1977) to more effectively
show the essential aspects of a sample distribution. There are many variants of the
box-and-whisker plot, but all are graphs that show the spread of the central 50% of
a distribution by a box whose lower limit is set at the first quartile and whose up-
per limit is set at the third quartile. The 50th percentile (second quartile or median)
usually is indicated by a line across the box. The mean, or arithmetic average of the
observations, may also be indicated by an asterisk or diamond. “Whiskers” are lines
that extend from the ends of the box, usually to the 5th and 95th percentiles. Ob-
servations lying beyond these extremes may be shown as dots. Figure 2-15 shows a
histogram and several alternative box-and-whisker plots produced by several pop-
ular commercial programs. The data are 125 airborne measurements of radiation
emitted by 13’Cs, recorded on the Istrian peninsula of Croatia. This component of
total radiation (see Fig. 2-11) reflects fallout from the Chernobyl reactor accident
in the Soviet Union during April of 1986. The data are given in file CROATRAD.TXT.
bc
0
a q&+m 00 0
0
Figure 2-15. Histogram and alternative forms of box-and-whisker plots of airborne measure-
ments of 137Cs radiation recorded on the lstrian peninsula of Croatia.
33