
Page 55 - Statistics and Data Analysis in Geology
P. 55
Matrix Algebra
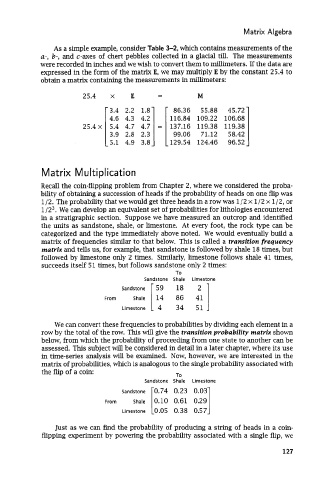
As a simple example, consider Table 3-2, which contains measurements of the
a-, b-, and c-axes of chert pebbles collected in a glacial till. The measurements
were recorded in inches and we wish to convert them to millimeters. If the data are
expressed in the form of the matrix E, we may multiply E by the constant 25.4 to
obtain a matrix containing the measurements in millimeters:
25.4 x E - M
-
3.4 2.2 1.8 86.36 55.88 45.72
4.6 4.3 4.2 116.84 109.22 106.68
25.4~ 5.4 4.7 4.7 = 137.16 119.38 119.38
13.9 2.8 2.31 [ 129.54 99.06 124.46 71.12 96.52 58.421
5.1 4.9 3.8
M at rix M u It i p I ica t ion
Recall the coin-flipping problem from Chapter 2, where we considered the proba-
bility of obtaining a succession of heads if the probability of heads on one flip was
1/2. The probability that we would get three heads in a row was 1/2 x 1/2 x 1/2, or
1/Z3. We can develop an equivalent set of probabilities for lithologies encountered
in a stratigraphic section. Suppose we have measured an outcrop and identified
the units as sandstone, shale, or limestone. At every foot, the rock type can be
categorized and the type immediately above noted. We would eventually build a
matrix of frequencies similar to that below. This is called a transition frequency
matrix and tells us, for example, that sandstone is followed by shale 18 times, but
followed by limestone only 2 times. Similarly, limestone follows shale 41 times,
succeeds itself 5 1 times, but follows sandstone only 2 times:
1
To
Sandstone Shale Limestone
Shale [ '4" !33 f
Sandstone 59 18
From
Limestone
We can convert these frequencies to probabilities by dividing each element in a
row by the total of the row. This will give the transition probability matrix shown
below, from which the probability of proceeding from one state to another can be
assessed. This subject will be considered in detail in a later chapter, where its use
in time-series analysis will be examined. Now, however, we are interested in the
matrix of probabilities, which is analogous to the single probability associated with
the flip of a coin:
To
Sandstone Shale Limestone
From
Just as we can find the probability of producing a string of heads in a coin-
flipping experiment by powering the probability associated with a single flip, we
127