
Page 180 - Statistics for Environmental Engineers
P. 180
L1592_frame_C21 Page 179 Tuesday, December 18, 2001 2:43 PM
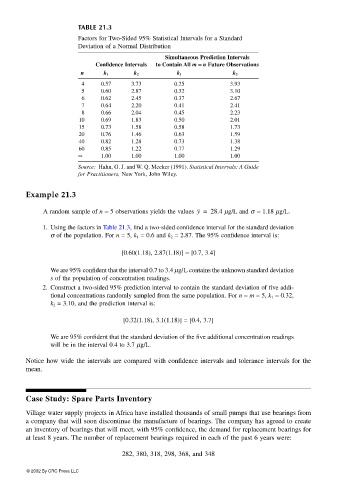
TABLE 21.3
Factors for Two-Sided 95% Statistical Intervals for a Standard
Deviation of a Normal Distribution
Simultaneous Prediction Intervals
Confidence Intervals to Contain All m == == n Future Observations
n k 1 k 2 k 1 k 2
4 0.57 3.73 0.25 3.93
5 0.60 2.87 0.32 3.10
6 0.62 2.45 0.37 2.67
7 0.64 2.20 0.41 2.41
8 0.66 2.04 0.45 2.23
10 0.69 1.83 0.50 2.01
15 0.73 1.58 0.58 1.73
20 0.76 1.46 0.63 1.59
40 0.82 1.28 0.73 1.38
60 0.85 1.22 0.77 1.29
∞ 1.00 1.00 1.00 1.00
Source: Hahn, G. J. and W. Q. Meeker (1991). Statistical Intervals: A Guide
for Practitioners, New York, John Wiley.
Example 21.3
A random sample of n = 5 observations yields the values y = 28.4 µg/L and σ = 1.18 µg/L.
1. Using the factors in Table 21.3, find a two-sided confidence interval for the standard deviation
σ of the population. For n = 5, k 1 = 0.6 and k 2 = 2.87. The 95% confidence interval is:
[0.60(1.18), 2.87(1.18)] = [0.7, 3.4]
We are 95% confident that the interval 0.7 to 3.4 µg/L contains the unknown standard deviation
s of the population of concentration readings.
2. Construct a two-sided 95% prediction interval to contain the standard deviation of five addi-
tional concentrations randomly sampled from the same population. For n = m = 5, k 1 = 0.32,
k 2 = 3.10, and the prediction interval is:
[0.32(1.18), 3.1(1.18)] = [0.4, 3.7]
We are 95% confident that the standard deviation of the five additional concentration readings
will be in the interval 0.4 to 3.7 µg/L.
Notice how wide the intervals are compared with confidence intervals and tolerance intervals for the
mean.
Case Study: Spare Parts Inventory
Village water supply projects in Africa have installed thousands of small pumps that use bearings from
a company that will soon discontinue the manufacture of bearings. The company has agreed to create
an inventory of bearings that will meet, with 95% confidence, the demand for replacement bearings for
at least 8 years. The number of replacement bearings required in each of the past 6 years were:
282, 380, 318, 298, 368, and 348
© 2002 By CRC Press LLC