
Page 178 - Statistics for Environmental Engineers
P. 178
L1592_frame_C21 Page 177 Tuesday, December 18, 2001 2:43 PM
Prediction Intervals
A prediction interval contains the expected results of a future sample to be obtained from a previously
sampled population or process. Based upon a past sample of measurements, we might wish to construct
a prediction interval to contain, with a specified degree of confidence: (1) the concentration of a randomly
selected single future unit from the sampled population, (2) the concentrations for five future specimens,
or (3) the average concentration of five future units.
The form of a two-sided prediction interval is the same as a confidence interval or a tolerance
interval:
y ± K 1−α, n s
The factor K 1−α,n has a 100(1 − α)% confidence level and depends on n, the number of observations in
the given sample, and also on whether the prediction interval is to contain a single future value, several
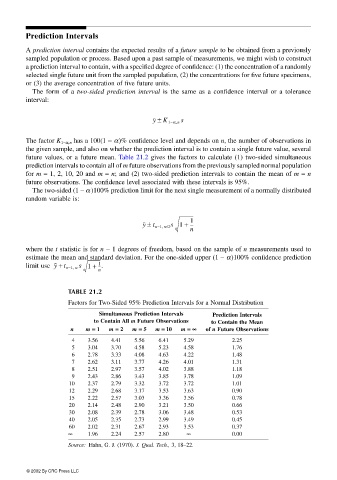
future values, or a future mean. Table 21.2 gives the factors to calculate (1) two-sided simultaneous
prediction intervals to contain all of m future observations from the previously sampled normal population
for m = 1, 2, 10, 20 and m = n; and (2) two-sided prediction intervals to contain the mean of m = n
future observations. The confidence level associated with these intervals is 95%.
The two-sided (1 − α )100% prediction limit for the next single measurement of a normally distributed
random variable is:
y ± t n−1, α/2 s 1 + 1
---
n
where the t statistic is for n − 1 degrees of freedom, based on the sample of n measurements used to
estimate the mean and standard deviation. For the one-sided upper (1 − α)100% confidence prediction
limit use y + t n−1, α s 1 + 1 ---.
n
TABLE 21.2
Factors for Two-Sided 95% Prediction Intervals for a Normal Distribution
Simultaneous Prediction Intervals Prediction Intervals
to Contain All m Future Observations to Contain the Mean
n m == == 1 m == == 2 m == == 5 m == == 10 m == == ∞∞ ∞∞ of n Future Observations
4 3.56 4.41 5.56 6.41 5.29 2.25
5 3.04 3.70 4.58 5.23 4.58 1.76
6 2.78 3.33 4.08 4.63 4.22 1.48
7 2.62 3.11 3.77 4.26 4.01 1.31
8 2.51 2.97 3.57 4.02 3.88 1.18
9 2.43 2.86 3.43 3.85 3.78 1.09
10 2.37 2.79 3.32 3.72 3.72 1.01
12 2.29 2.68 3.17 3.53 3.63 0.90
15 2.22 2.57 3.03 3.36 3.56 0.78
20 2.14 2.48 2.90 3.21 3.50 0.66
30 2.08 2.39 2.78 3.06 3.48 0.53
40 2.05 2.35 2.73 2.99 3.49 0.45
60 2.02 2.31 2.67 2.93 3.53 0.37
∞ 1.96 2.24 2.57 2.80 ∞ 0.00
Source: Hahn, G. J. (1970). J. Qual. Tech., 3, 18–22.
© 2002 By CRC Press LLC