
Page 174 - Statistics for Environmental Engineers
P. 174
L1592_Frame_C20 Page 173 Tuesday, December 18, 2001 1:53 PM
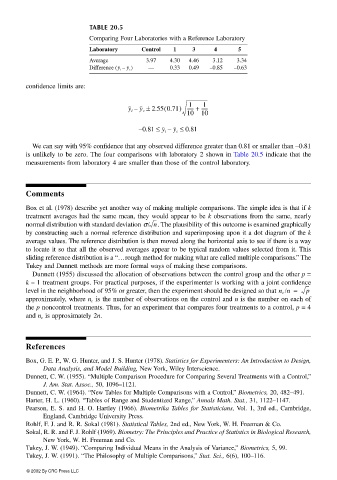
TABLE 20.5
Comparing Four Laboratories with a Reference Laboratory
Laboratory Control 1 3 4 5
Average 3.97 4.30 4.46 3.12 3.34
(
Difference y i – y c ) — 0.33 0.49 –0.85 –0.63
confidence limits are:
1
1
(
y i – y c ± 2.55 0.71) ------ + ------
10 10
– 0.81 ≤ y i – y c ≤ 0.81
We can say with 95% confidence that any observed difference greater than 0.81 or smaller than −0.81
is unlikely to be zero. The four comparisons with laboratory 2 shown in Table 20.5 indicate that the
measurements from laboratory 4 are smaller than those of the control laboratory.
Comments
Box et al. (1978) describe yet another way of making multiple comparisons. The simple idea is that if k
treatment averages had the same mean, they would appear to be k observations from the same, nearly
normal distribution with standard deviation σ/ n. The plausibility of this outcome is examined graphically
by constructing such a normal reference distribution and superimposing upon it a dot diagram of the k
average values. The reference distribution is then moved along the horizontal axis to see if there is a way
to locate it so that all the observed averages appear to be typical random values selected from it. This
sliding reference distribution is a “…rough method for making what are called multiple comparisons.” The
Tukey and Dunnett methods are more formal ways of making these comparisons.
Dunnett (1955) discussed the allocation of observations between the control group and the other p =
k – 1 treatment groups. For practical purposes, if the experimenter is working with a joint confidence
level in the neighborhood of 95% or greater, then the experiment should be designed so that n c /n = p
approximately, where n c is the number of observations on the control and n is the number on each of
the p noncontrol treatments. Thus, for an experiment that compares four treatments to a control, p = 4
and n c is approximately 2n.
References
Box, G. E. P., W. G. Hunter, and J. S. Hunter (1978). Statistics for Experimenters: An Introduction to Design,
Data Analysis, and Model Building, New York, Wiley Interscience.
Dunnett, C. W. (1955). “Multiple Comparison Procedure for Comparing Several Treatments with a Control,”
J. Am. Stat. Assoc., 50, 1096–1121.
Dunnett, C. W. (1964). “New Tables for Multiple Comparisons with a Control,” Biometrics, 20, 482–491.
Harter, H. L. (1960). “Tables of Range and Studentized Range,” Annals Math. Stat., 31, 1122–1147.
Pearson, E. S. and H. O. Hartley (1966). Biometrika Tables for Statisticians, Vol. 1, 3rd ed., Cambridge,
England, Cambridge University Press.
Rohlf, F. J. and R. R. Sokal (1981). Statistical Tables, 2nd ed., New York, W. H. Freeman & Co.
Sokal, R. R. and F. J. Rohlf (1969). Biometry: The Principles and Practice of Statistics in Biological Research,
New York, W. H. Freeman and Co.
Tukey, J. W. (1949). “Comparing Individual Means in the Analysis of Variance,” Biometrics, 5, 99.
Tukey, J. W. (1991). “The Philosophy of Multiple Comparisons,” Stat. Sci., 6(6), 100–116.
© 2002 By CRC Press LLC