
Page 177 - Statistics for Environmental Engineers
P. 177
L1592_frame_C21 Page 176 Tuesday, December 18, 2001 2:43 PM
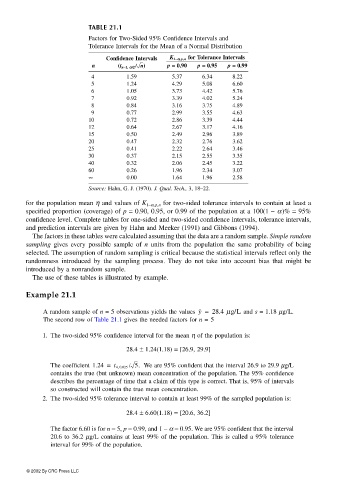
TABLE 21.1
Factors for Two-Sided 95% Confidence Intervals and
Tolerance Intervals for the Mean of a Normal Distribution
Confidence Intervals K 1−− −−αα αα, p, n for Tolerance Intervals
n (t n−− −−1, αα αα// //22 22 // // n ) p == == 0.90 p == == 0.95 p == == 0.99
4 1.59 5.37 6.34 8.22
5 1.24 4.29 5.08 6.60
6 1.05 3.73 4.42 5.76
7 0.92 3.39 4.02 5.24
8 0.84 3.16 3.75 4.89
9 0.77 2.99 3.55 4.63
10 0.72 2.86 3.39 4.44
12 0.64 2.67 3.17 4.16
15 0.50 2.49 2.96 3.89
20 0.47 2.32 2.76 3.62
25 0.41 2.22 2.64 3.46
30 0.37 2.15 2.55 3.35
40 0.32 2.06 2.45 3.22
60 0.26 1.96 2.34 3.07
∞ 0.00 1.64 1.96 2.58
Source: Hahn, G. J. (1970). J. Qual. Tech., 3, 18–22.
for the population mean η and values of K 1−α,p,n for two-sided tolerance intervals to contain at least a
specified proportion (coverage) of p = 0.90, 0.95, or 0.99 of the population at a 100(1 − α)% = 95%
confidence level. Complete tables for one-sided and two-sided confidence intervals, tolerance intervals,
and prediction intervals are given by Hahn and Meeker (1991) and Gibbons (1994).
The factors in these tables were calculated assuming that the data are a random sample. Simple random
sampling gives every possible sample of n units from the population the same probability of being
selected. The assumption of random sampling is critical because the statistical intervals reflect only the
randomness introduced by the sampling process. They do not take into account bias that might be
introduced by a nonrandom sample.
The use of these tables is illustrated by example.
Example 21.1
A random sample of n = 5 observations yields the values y = 28.4 µg/L and s = 1.18 µg/L.
The second row of Table 21.1 gives the needed factors for n = 5
1. The two-sided 95% confidence interval for the mean η of the population is:
28.4 ± 1.24(1.18) = [26.9, 29.9]
The coefficient 1.24 = t 4, 0.025 / 5. We are 95% confident that the interval 26.9 to 29.9 µg/L
contains the true (but unknown) mean concentration of the population. The 95% confidence
describes the percentage of time that a claim of this type is correct. That is, 95% of intervals
so constructed will contain the true mean concentration.
2. The two-sided 95% tolerance interval to contain at least 99% of the sampled population is:
28.4 ± 6.60(1.18) = [20.6, 36.2]
The factor 6.60 is for n = 5, p = 0.99, and 1 − α = 0.95. We are 95% confident that the interval
20.6 to 36.2 µg/L contains at least 99% of the population. This is called a 95% tolerance
interval for 99% of the population.
© 2002 By CRC Press LLC