
Page 173 - Statistics for Environmental Engineers
P. 173
L1592_Frame_C20 Page 172 Tuesday, December 18, 2001 1:53 PM
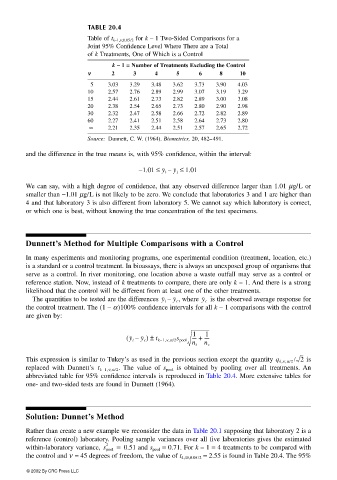
TABLE 20.4
Table of t k–1,ν,0.05 /2 for k – 1 Two-Sided Comparisons for a
Joint 95% Confidence Level Where There are a Total
of k Treatments, One of Which is a Control
k – 1 = Number of Treatments Excluding the Control
νν νν 2 3 4 5 6 8 10
5 3.03 3.29 3.48 3.62 3.73 3.90 4.03
10 2.57 2.76 2.89 2.99 3.07 3.19 3.29
15 2.44 2.61 2.73 2.82 2.89 3.00 3.08
20 2.38 2.54 2.65 2.73 2.80 2.90 2.98
30 2.32 2.47 2.58 2.66 2.72 2.82 2.89
60 2.27 2.41 2.51 2.58 2.64 2.73 2.80
∞ 2.21 2.35 2.44 2.51 2.57 2.65 2.72
Source: Dunnett, C. W. (1964). Biometrics, 20, 482–491.
and the difference in the true means is, with 95% confidence, within the interval:
– 1.01 ≤ y i – y j ≤ 1.01
We can say, with a high degree of confidence, that any observed difference larger than 1.01 µg/L or
smaller than −1.01 µg/L is not likely to be zero. We conclude that laboratories 3 and 1 are higher than
4 and that laboratory 3 is also different from laboratory 5. We cannot say which laboratory is correct,
or which one is best, without knowing the true concentration of the test specimens.
Dunnett’s Method for Multiple Comparisons with a Control
In many experiments and monitoring programs, one experimental condition (treatment, location, etc.)
is a standard or a control treatment. In bioassays, there is always an unexposed group of organisms that
serve as a control. In river monitoring, one location above a waste outfall may serve as a control or
reference station. Now, instead of k treatments to compare, there are only k – 1. And there is a strong
likelihood that the control will be different from at least one of the other treatments.
The quantities to be tested are the differences y i – y c , where y c is the observed average response for
the control treatment. The (1 – α)100% confidence intervals for all k – 1 comparisons with the control
are given by:
1
1
( y i – y c ) ± t k–1,ν,α/2 s pool ---- + ----
n i n c
This expression is similar to Tukey’s as used in the previous section except the quantity q k,ν,α/2 / 2 is
replaced with Dunnett’s t k–1,ν,α/2 . The value of s pool is obtained by pooling over all treatments. An
abbreviated table for 95% confidence intervals is reproduced in Table 20.4. More extensive tables for
one- and two-sided tests are found in Dunnett (1964).
Solution: Dunnet’s Method
Rather than create a new example we reconsider the data in Table 20.1 supposing that laboratory 2 is a
reference (control) laboratory. Pooling sample variances over all five laboratories gives the estimated
within-laboratory variance, s pool = 0.51 and s pool = 0.71. For k – 1 = 4 treatments to be compared with
2
the control and ν = 45 degrees of freedom, the value of t 4,45,0.05 /2 = 2.55 is found in Table 20.4. The 95%
© 2002 By CRC Press LLC