
Page 169 - Statistics for Environmental Engineers
P. 169
L1592_frame_C19.fm Page 167 Tuesday, December 18, 2001 1:53 PM
that a well truly in compliance may register above the 10 µg/L limit. Assuming that all wells are
truly in compliance: (a) What is the probability that 2 of 20 wells will be observed above the
limit? (b) What is the probability that 3 of 20 are above? (c) That none are above?
19.2 Control Group. Two groups, A and B, consist of 100 healthy organisms each. Group A, a
control group, is put into a pond that is fed by a clean stream. Group B is put into a pond
that receives a portion of wastewater effluent in the same stream water. After some time it is
found that in groups A and B, 25 and 35 organisms, respectively, have an unusual condition.
At significance levels of (a) 0.01, (b) 0.05, and (c) 0.10, test the hypothesis that something
in the wastewater is harming the organisms.
19.3 Censored Data. Test specimens of water from monitoring wells sometimes contain a concen-
tration of the target pollutant that is too low to be detected. These are reported as ND, to
signify not detected. Thirty of forty wells beneath a landfill had ND levels of the target
pollutant, while nine of ten wells some distance from the landfill had ND levels. How strong
is the evidence that the landfill is polluting the groundwater?
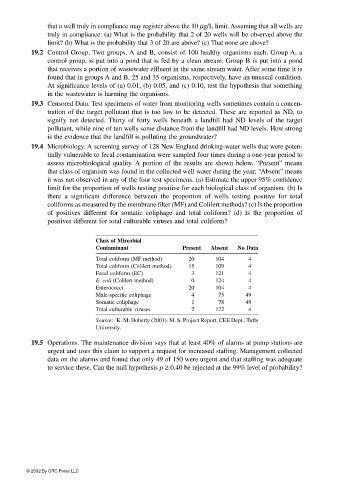
19.4 Microbiology. A screening survey of 128 New England drinking-water wells that were poten-
tially vulnerable to fecal contamination were sampled four times during a one-year period to
assess microbiological quality. A portion of the results are shown below. “Present” means
that class of organism was found in the collected well water during the year; “Absent” means
it was not observed in any of the four test specimens. (a) Estimate the upper 95% confidence
limit for the proportion of wells testing positive for each biological class of organism. (b) Is
there a significant difference between the proportion of wells testing positive for total
coliforms as measured by the membrane filter (MF) and Colilert methods? (c) Is the proportion
of positives different for somatic coliphage and total coliform? (d) Is the proportion of
positives different for total culturable viruses and total coliform?
Class of Mircobial
Contaminant Present Absent No Data
Total coliform (MF method) 20 104 4
Total coliform (Colilert method) 15 109 4
Fecal coliform (EC) 3 121 4
E. coli (Colilert method) 0 124 4
Enterococci 20 104 4
Male-specific coliphage 4 75 49
Somatic coliphage 1 78 49
Total culturable viruses 2 122 4
Source: K. M. Doherty (2001). M. S. Project Report, CEE Dept., Tufts
University.
19.5 Operations. The maintenance division says that at least 40% of alarms at pump stations are
urgent and uses this claim to support a request for increased staffing. Management collected
data on the alarms and found that only 49 of 150 were urgent and that staffing was adequate
to service these. Can the null hypothesis p ≥ 0.40 be rejected at the 99% level of probability?
© 2002 By CRC Press LLC