Page 164 - Statistics for Environmental Engineers
P. 164

L1592_frame_C19.fm  Page 162  Tuesday, December 18, 2001  1:53 PM
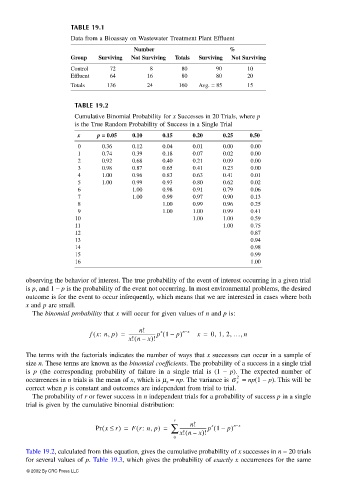


                                   TABLE 19.1
                                   Data from a Bioassay on Wastewater Treatment Plant Effluent
                                                     Number                    %
                                   Group   Surviving  Not Surviving  Totals  Surviving  Not Surviving
                                   Control    72         8        80       90       10
                                   Effluent    64        16        80       80       20
                                   Totals    136        24       160   Avg. = 85    15


                                    TABLE 19.2
                                    Cumulative Binomial Probability for x Successes in 20 Trials, where p
                                    is the True Random Probability of Success in a Single Trial
                                     x    p == == 0.05  0.10  0.15   0.20    0.25    0.50
                                     0      0.36    0.12     0.04    0.01    0.00    0.00
                                     1      0.74    0.39     0.18    0.07    0.02    0.00
                                     2      0.92    0.68     0.40    0.21    0.09    0.00
                                     3      0.98    0.87     0.65    0.41    0.23    0.00
                                     4      1.00    0.96     0.83    0.63    0.41    0.01
                                     5      1.00    0.99     0.93    0.80    0.62    0.02
                                     6              1.00     0.98    0.91    0.79    0.06
                                     7              1.00     0.99    0.97    0.90    0.13
                                     8                       1.00    0.99    0.96    0.25
                                     9                       1.00    1.00    0.99    0.41
                                    10                               1.00    1.00    0.59
                                    11                                       1.00    0.75
                                    12                                               0.87
                                    13                                               0.94
                                    14                                               0.98
                                    15                                               0.99
                                    16                                               1.00

                       observing the behavior of interest. The true probability of the event of interest occurring in a given trial
                       is p, and 1 − p is the probability of the event not occurring. In most environmental problems, the desired
                       outcome is for the event to occur infrequently, which means that we are interested in cases where both
                       x and p are small.
                        The binomial probability that x will occur for given values of n and p is:

                                                      n!
                                         (
                                        f x: n, p) =  ----------------------- p 1 –(  p)  n−x  x =  0, 1, 2, …, n
                                                            x
                                                     (
                                                   x! n –  x)!
                       The terms with the factorials indicates the number of ways that x successes can occur in a sample of
                       size n. These terms are known as the binomial coefficients. The probability of a success in a single trial
                       is  p (the corresponding probability of  failure in a single trial is (1  −  p).  The  expected number of
                                                                                 2
                       occurrences in n trials is the mean of x, which is µ x  = np. The variance is σ x  = np(1 − p). This will be
                       correct when p is constant and outcomes are independent from trial to trial.
                        The probability of r or fewer success in n independent trials for a probability of success p in a single
                       trial is given by the cumulative binomial distribution:

                                                                r
                                                                    n!
                                                                          x
                                            (
                                          Pr x ≤  r) =  Fr: n, p) =  ∑ ----------------------- p 1 –(  p)  n−x
                                                     (
                                                                   (
                                                                0  x! n –  x)!
                       Table 19.2, calculated from this equation, gives the cumulative probability of x successes in n = 20 trials
                       for several values of p. Table 19.3, which gives the probability of exactly x occurrences for the same
                       © 2002 By CRC Press LLC
   159   160   161   162   163   164   165   166   167   168   169