
Page 162 - Statistics for Environmental Engineers
P. 162
L1592_frame_C18.fm Page 160 Tuesday, December 18, 2001 1:52 PM
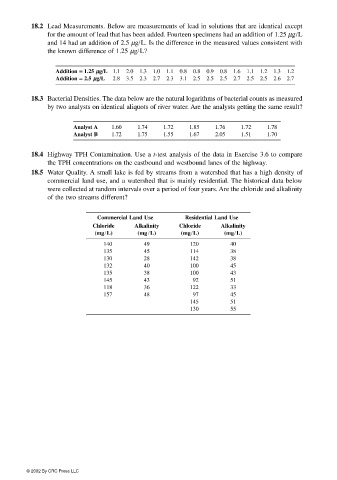
18.2 Lead Measurements. Below are measurements of lead in solutions that are identical except
for the amount of lead that has been added. Fourteen specimens had an addition of 1.25 µg/L
and 14 had an addition of 2.5 µg/L. Is the difference in the measured values consistent with
the known difference of 1.25 µg/L?
Addition == == 1.25 µµ µµg// //L 1.1 2.0 1.3 1.0 1.1 0.8 0.8 0.9 0.8 1.6 1.1 1.2 1.3 1.2
Addition == == 2.5 µµ µµg// //L 2.8 3.5 2.3 2.7 2.3 3.1 2.5 2.5 2.5 2.7 2.5 2.5 2.6 2.7
18.3 Bacterial Densities. The data below are the natural logarithms of bacterial counts as measured
by two analysts on identical aliquots of river water. Are the analysts getting the same result?
Analyst A 1.60 1.74 1.72 1.85 1.76 1.72 1.78
Analyst B 1.72 1.75 1.55 1.67 2.05 1.51 1.70
18.4 Highway TPH Contamination. Use a t-test analysis of the data in Exercise 3.6 to compare
the TPH concentrations on the eastbound and westbound lanes of the highway.
18.5 Water Quality. A small lake is fed by streams from a watershed that has a high density of
commercial land use, and a watershed that is mainly residential. The historical data below
were collected at random intervals over a period of four years. Are the chloride and alkalinity
of the two streams different?
‘
Commercial Land Use Residential Land Use
Chloride Alkalinity Chloride Alkalinity
(mg/L) (mg /L) (mg/L) (mg/L)
‘
140 49 120 40
135 45 114 38
130 28 142 38
132 40 100 45
135 38 100 43
145 43 92 51
118 36 122 33
157 48 97 45
145 51
130 55
‘
© 2002 By CRC Press LLC