Page 158 - Statistics for Environmental Engineers
P. 158

L1592_frame_C17  Page 155  Tuesday, December 18, 2001  1:51 PM


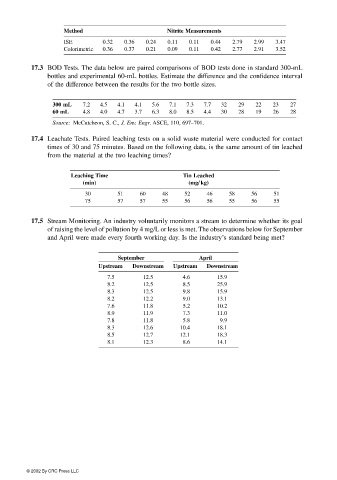
                                 Method                       Nitrite Measurements
                                 ISE        0.32  0.36  0.24  0.11  0.11  0.44  2.79  2.99  3.47
                                 Colorimetric  0.36  0.37  0.21  0.09  0.11  0.42  2.77  2.91  3.52

                        17.3 BOD Tests. The data below are paired comparisons of BOD tests done in standard 300-mL
                             bottles and experimental 60-mL bottles. Estimate the difference and the confidence interval
                             of the difference between the results for the two bottle sizes.


                              300 mL  7.2  4.5  4.1  4.1  5.6  7.1  7.3  7.7  32  29  22   23   27
                              60 mL   4.8  4.0  4.7  3.7  6.3  8.0  8.5  4.4  30  28  19   26   28
                              Source: McCutcheon, S. C., J. Env. Engr. ASCE, 110, 697–701.

                        17.4 Leachate Tests. Paired leaching tests on a solid waste material were conducted for contact
                             times of 30 and 75 minutes. Based on the following data, is the same amount of tin leached
                             from the material at the two leaching times?

                                   Leaching Time                  Tin Leached
                                      (min)                         (mg/ kg)
                                       30       51    60    48     52    46    58    56    51
                                       75       57    57    55     56    56    55    56    55

                        17.5 Stream Monitoring. An industry voluntarily monitors a stream to determine whether its goal
                             of raising the level of pollution by 4 mg/L or less is met. The observations below for September
                             and April were made every fourth working day. Is the industry’s standard being met?

                                                September              April
                                           Upstream  Downstream  Upstream  Downstream
                                             7.5       12.5       4.6       15.9
                                             8.2       12.5       8.5       25.9
                                             8.3       12.5       9.8       15.9
                                             8.2       12.2       9.0       13.1
                                             7.6       11.8       5.2       10.2
                                             8.9       11.9       7.3       11.0
                                             7.8       11.8       5.8        9.9
                                             8.3       12.6      10.4       18.1
                                             8.5       12.7      12.1       18.3
                                             8.1       12.3       8.6       14.1


                       © 2002 By CRC Press LLC
   153   154   155   156   157   158   159   160   161   162   163