
Page 156 - Statistics for Environmental Engineers
P. 156
L1592_frame_C17 Page 153 Tuesday, December 18, 2001 1:51 PM
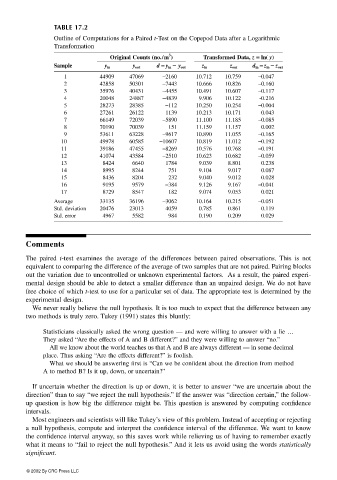
TABLE 17.2
Outline of Computations for a Paired t-Test on the Copepod Data after a Logarithmic
Transformation
3
Original Counts (no./m ) Transformed Data, z == == ln( y)
Sample y in y out d == == y in −− −− y out z in z out d ln == == z in −− −− z out
1 44909 47069 −2160 10.712 10.759 −0.047
2 42858 50301 −7443 10.666 10.826 −0.160
3 35976 40431 −4455 10.491 10.607 −0.117
4 20048 24887 −4839 9.906 10.122 -0.216
5 28273 28385 −112 10.250 10.254 −0.004
6 27261 26122 1139 10.213 10.171 0.043
7 66149 72039 −5890 11.100 11.185 −0.085
8 70190 70039 151 11.159 11.157 0.002
9 53611 63228 −9617 10.890 11.055 −0.165
10 49978 60585 −10607 10.819 11.012 −0.192
11 39186 47455 −8269 10.576 10.768 −0.191
12 41074 43584 −2510 10.623 10.682 −0.059
13 8424 6640 1784 9.039 8.801 0.238
14 8995 8244 751 9.104 9.017 0.087
15 8436 8204 232 9.040 9.012 0.028
16 9195 9579 −384 9.126 9.167 −0.041
17 8729 8547 182 9.074 9.053 0.021
Average 33135 36196 –3062 10.164 10.215 −0.051
Std. deviation 20476 23013 4059 0.785 0.861 0.119
Std. error 4967 5582 984 0.190 0.209 0.029
Comments
The paired t-test examines the average of the differences between paired observations. This is not
equivalent to comparing the difference of the average of two samples that are not paired. Pairing blocks
out the variation due to uncontrolled or unknown experimental factors. As a result, the paired experi-
mental design should be able to detect a smaller difference than an unpaired design. We do not have
free choice of which t-test to use for a particular set of data. The appropriate test is determined by the
experimental design.
We never really believe the null hypothesis. It is too much to expect that the difference between any
two methods is truly zero. Tukey (1991) states this bluntly:
Statisticians classically asked the wrong question — and were willing to answer with a lie …
They asked “Are the effects of A and B different?” and they were willing to answer “no.”
All we know about the world teaches us that A and B are always different — in some decimal
place. Thus asking “Are the effects different?” is foolish.
What we should be answering first is “Can we be confident about the direction from method
A to method B? Is it up, down, or uncertain?”
If uncertain whether the direction is up or down, it is better to answer “we are uncertain about the
direction” than to say “we reject the null hypothesis.” If the answer was “direction certain,” the follow-
up question is how big the difference might be. This question is answered by computing confidence
intervals.
Most engineers and scientists will like Tukey’s view of this problem. Instead of accepting or rejecting
a null hypothesis, compute and interpret the confidence interval of the difference. We want to know
the confidence interval anyway, so this saves work while relieving us of having to remember exactly
what it means to “fail to reject the null hypothesis.” And it lets us avoid using the words statistically
significant.
© 2002 By CRC Press LLC