Page 166 - Statistics for Environmental Engineers
P. 166

L1592_frame_C19.fm  Page 164  Tuesday, December 18, 2001  1:53 PM


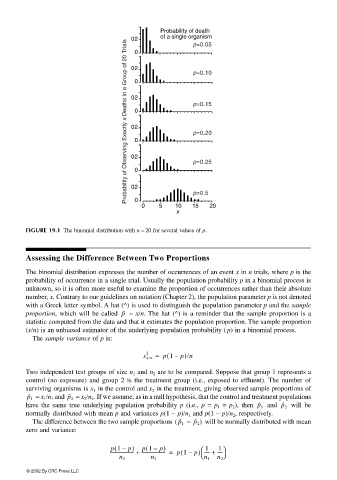
                                                  Probabiltiy of Observing Exactly x Deaths in a Group of 20 Trials
                                                            Probability of death
                                                            of a single organism
                                                    0.2
                                                                     p=0.05
                                                     0
                                                    0.2
                                                                     p=0.10
                                                     0

                                                    0.2
                                                                     p=0.15
                                                     0

                                                    0.2
                                                                     p=0.20
                                                     0

                                                    0.2
                                                                     p=0.25
                                                     0

                                                    0.2
                                                                     p=0.5
                                                     0
                                                       0    5   10   15   20
                                                                x


                       FIGURE 19.1 The binomial distribution with n = 20 for several values of p.


                       Assessing the Difference Between Two Proportions

                       The binomial distribution expresses the number of occurrences of an event x in n trials, where p is the
                       probability of occurrence in a single trial. Usually the population probability p in a binomial process is
                       unknown, so it is often more useful to examine the proportion of occurrences rather than their absolute
                       number, x. Contrary to our guidelines on notation (Chapter 2), the population parameter p is not denoted
                       with a Greek letter symbol. A hat (^) is used to distinguish the population parameter p and the sample
                       proportion, which will be called  p ˆ   = x/n. The hat (^) is a reminder that the sample proportion is a
                       statistic computed from the data and that it estimates the population proportion. The sample proportion
                       (x/n) is an unbiased estimator of the underlying population probability (p) in a binomial process.
                        The sample variance of p is:

                                                       s x/n =  p 1 –  p)/n
                                                              (
                                                        2
                       Two independent test groups of size n 1  and n 2  are to be compared. Suppose that group 1 represents a
                       control (no exposure) and group 2 is the treatment group (i.e., exposed to effluent). The number of
                       surviving organisms is x 1  in the control and x 2  in the treatment, giving observed sample proportions of
                                     = x 2 /n 2 . If we assume, as in a null hypothesis, that the control and treatment populations
                       p ˆ 1   = x 1 /n 1  and p ˆ 2
                                                                                                will be
                       have the same true underlying population probability p (i.e.,  p =  p 1   =  p 2 ), then  p ˆ 1   and  p ˆ 2
                       normally distributed with mean p and variances p(1 − p)/n 1  and p(1 − p)/n 2 , respectively.
                                                                    −  p ˆ 2 )   will be normally distributed with mean
                        The difference between the two sample proportions (p ˆ 1
                       zero and variance:
                                               (
                                                        (
                                                   p)
                                                                        1
                                                                            1
                                              p 1 –
                                                                       
                                              --------------------- +  p 1 –  p)  p 1 –  p) ----- +  -----  
                                                                  (
                                                       --------------------- =
                                                                       
                                                 n 1     n 2            n 1  n 2
                       © 2002 By CRC Press LLC
   161   162   163   164   165   166   167   168   169   170   171