Page 171 - Statistics for Environmental Engineers
P. 171

L1592_Frame_C20  Page 170  Tuesday, December 18, 2001  1:53 PM
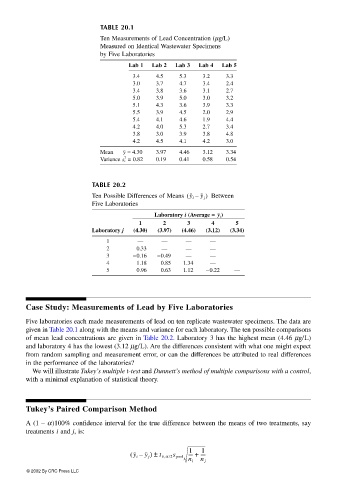


                                           TABLE 20.1
                                           Ten Measurements of Lead Concentration (µg/L)
                                           Measured on Identical Wastewater Specimens
                                           by Five Laboratories
                                                   Lab 1  Lab 2  Lab 3  Lab 4  Lab 5
                                                    3.4    4.5   5.3    3.2   3.3
                                                    3.0    3.7   4.7    3.4   2.4
                                                    3.4    3.8   3.6    3.1   2.7
                                                    5.0    3.9   5.0    3.0   3.2
                                                    5.1    4.3   3.6    3.9   3.3
                                                    5.5    3.9   4.5    2.0   2.9
                                                    5.4    4.1   4.6    1.9   4.4
                                                    4.2    4.0   5.3    2.7   3.4
                                                    3.8    3.0   3.9    3.8   4.8
                                                    4.2    4.5   4.1    4.2   3.0
                                           Mean   y  = 4.30  3.97  4.46  3.12  3.34
                                                  2
                                           Variance   = 0.82  0.19  0.41  0.58  0.54
                                                 s i

                                         TABLE 20.2
                                         Ten Possible Differences of Means  y i –(  y j )   Between
                                         Five Laboratories
                                                                            y
                                                          Laboratory i (Average =  ) i
                                                      1      2     3      4      5
                                         Laboratory j  (4.30)  (3.97)  (4.46)  (3.12)  (3.34)
                                             1        —     —      —      —
                                             2       0.33   —      —      —
                                             3      −0.16  −0.49   —      —
                                             4       1.18   0.85  1.34    —
                                             5       0.96   0.63  1.12   −0.22  —


                       Case Study: Measurements of Lead by Five Laboratories
                       Five laboratories each made measurements of lead on ten replicate wastewater specimens. The data are
                       given in Table 20.1 along with the means and variance for each laboratory. The ten possible comparisons
                       of mean lead concentrations are given in Table 20.2. Laboratory 3 has the highest mean (4.46 µg/L)
                       and laboratory 4 has the lowest (3.12 µg/L). Are the differences consistent with what one might expect
                       from random sampling and measurement error, or can the differences be attributed to real differences
                       in the performance of the laboratories?
                        We will illustrate Tukey’s multiple t-test and Dunnett’s method of multiple comparisons with a control,
                       with a minimal explanation of statistical theory.


                       Tukey’s Paired Comparison Method

                       A (1 – α)100% confidence interval for the true difference between the means of two treatments, say
                       treatments i and j, is:


                                                                    1
                                                                       1
                                                    ( y i –  y j ) ± t ν,α /2 s pool ---- +  ----
                                                                    n i  n j
                       © 2002 By CRC Press LLC
   166   167   168   169   170   171   172   173   174   175   176