Page 191 - Statistics for Environmental Engineers
P. 191

L1592_frame_C22  Page 191  Tuesday, December 18, 2001  2:43 PM


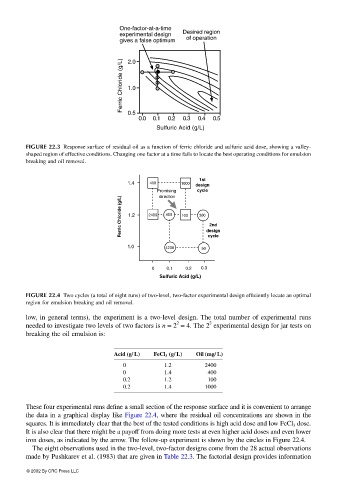
                                                 One-factor-at-a-time
                                                 experimental design  Desired region
                                                 gives a false optimum  of operation

                                                 Ferric Chloride (g/L)  1.0
                                                   2.0


                                                   0.5
                                                      0.0     0.1      0.2      0.3      0.4      0.5
                                                           Sulfuric Acid (g/L)

                       FIGURE 22.3 Response surface of residual oil as a function of ferric chloride and sulfuric acid dose, showing a valley-
                       shaped region of effective conditions. Changing one factor at a time fails to locate the best operating conditions for emulsion
                       breaking and oil removal.

                                                                       1st
                                                   1.4   400      1000
                                                                      design
                                                           Promising   cycle
                                                            direction
                                                 Ferric Chloride (g/L)  1.2  2400  400  100  300  design

                                                                          2nd

                                                   1.0       4200      50  cycle


                                                          0   0.1  0.2  0.3
                                                            Sulfuric Acid (g/L)

                       FIGURE 22.4 Two cycles (a total of eight runs) of two-level, two-factor experimental design efficiently locate an optimal
                       region for emulsion breaking and oil removal.

                       low, in general terms), the  experiment is a two-level design. The total number of  experimental runs
                                                                 2
                                                                          2
                       needed to investigate two levels of two factors is n = 2  = 4. The 2  experimental design for jar tests on
                       breaking the oil emulsion is:
                                               Acid (g/ L)  FeCl 3  (g/ L)  Oil (mg/ L)
                                                  0          1.2        2400
                                                  0          1.4         400
                                                  0.2        1.2         100
                                                  0.2        1.4        1000

                       These four experimental runs define a small section of the response surface and it is convenient to arrange
                       the data in a graphical display like Figure 22.4, where the residual oil concentrations are shown in the
                       squares. It is immediately clear that the best of the tested conditions is high acid dose and low FeCl 3  dose.
                       It is also clear that there might be a payoff from doing more tests at even higher acid doses and even lower
                       iron doses, as indicated by the arrow. The follow-up experiment is shown by the circles in Figure 22.4.
                        The eight observations used in the two-level, two-factor designs come from the 28 actual observations
                       made by Pushkarev et al. (1983) that are given in Table 22.3. The factorial design provides information
                       © 2002 By CRC Press LLC
   186   187   188   189   190   191   192   193   194   195   196