
Page 193 - Statistics for Environmental Engineers
P. 193
L1592_frame_C22 Page 193 Tuesday, December 18, 2001 2:43 PM
New New pressure
pressure
Yield 10 Yield 10
Standard Standard
pressure pressure
Standard New Standard New
Temperature Temperature
Yield = 11 Yield = 11
12
Pressure 10 7 Pressure 10 7 optional
Temperature Temperature
One-Factor-at-a Time Two-level Factorial
Experiment Design Experiment
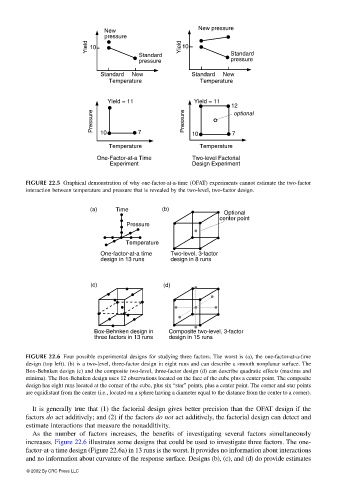
FIGURE 22.5 Graphical demonstration of why one-factor-at-a-time (OFAT) experiments cannot estimate the two-factor
interaction between temperature and pressure that is revealed by the two-level, two-factor design.
(a) Time (b)
Optional
center point
Pressure
Temperature
One-factor-at-a time Two-level, 3-factor
design in 13 runs design in 8 runs
(c) (d)
Box-Behnken design in Composite two-level, 3-factor
three factors in 13 runs design in 15 runs
FIGURE 22.6 Four possible experimental designs for studying three factors. The worst is (a), the one-factor-at-a-time
design (top left). (b) is a two-level, three-factor design in eight runs and can describe a smooth nonplanar surface. The
Box-Behnken design (c) and the composite two-level, three-factor design (d) can describe quadratic effects (maxima and
minima). The Box-Behnken design uses 12 observations located on the face of the cube plus a center point. The composite
design has eight runs located at the corner of the cube, plus six “star” points, plus a center point. The corner and star points
are equidistant from the center (i.e., located on a sphere having a diameter equal to the distance from the center to a corner).
It is generally true that (1) the factorial design gives better precision than the OFAT design if the
factors do act additively; and (2) if the factors do not act additively, the factorial design can detect and
estimate interactions that measure the nonadditivity.
As the number of factors increases, the benefits of investigating several factors simultaneously
increases. Figure 22.6 illustrates some designs that could be used to investigate three factors. The one-
factor-at-a time design (Figure 22.6a) in 13 runs is the worst. It provides no information about interactions
and no information about curvature of the response surface. Designs (b), (c), and (d) do provide estimates
© 2002 By CRC Press LLC