
Page 196 - Statistics for Environmental Engineers
P. 196
L1592_frame_C22 Page 196 Tuesday, December 18, 2001 2:43 PM
22.5 Personal Work. Consider an experiment that you have performed. It may be a series of
analytical measurements, an instrument calibration, or a process experiment. Describe how
the principles of direct comparison, replication, randomization, and blocking were incorpo-
rated into the experiment. If they were not practiced, explain why they were not needed, or
why they were not used. Or, suggest how the experiment could have been improved by using
them.
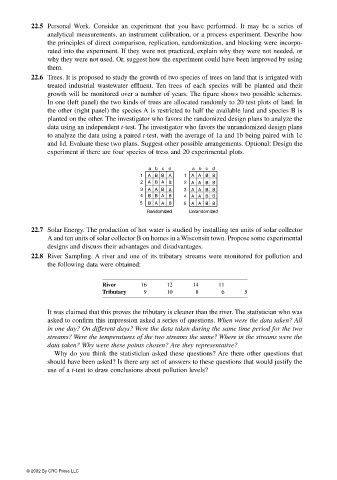
22.6 Trees. It is proposed to study the growth of two species of trees on land that is irrigated with
treated industrial wastewater effluent. Ten trees of each species will be planted and their
growth will be monitored over a number of years. The figure shows two possible schemes.
In one (left panel) the two kinds of trees are allocated randomly to 20 test plots of land. In
the other (right panel) the species A is restricted to half the available land and species B is
planted on the other. The investigator who favors the randomized design plans to analyze the
data using an independent t-test. The investigator who favors the unrandomized design plans
to analyze the data using a paired t-test, with the average of 1a and 1b being paired with 1c
and 1d. Evaluate these two plans. Suggest other possible arrangements. Optional: Design the
experiment if there are four species of tress and 20 experimental plots.
ab c d ab c d
1 A BB A 1 A A B B
2 A B A B 2 A A B B
3 A A B A 3 A A B B
4 B B A B 4 A A B B
5 B AA B 5 A A B B
Randomized Unrandomized
22.7 Solar Energy. The production of hot water is studied by installing ten units of solar collector
A and ten units of solar collector B on homes in a Wisconsin town. Propose some experimental
designs and discuss their advantages and disadvantages.
22.8 River Sampling. A river and one of its tributary streams were monitored for pollution and
the following data were obtained:
River 16 12 14 11
Tributary 9 10 8 6 5
It was claimed that this proves the tributary is cleaner than the river. The statistician who was
asked to confirm this impression asked a series of questions. When were the data taken? All
in one day? On different days? Were the data taken during the same time period for the two
streams? Were the temperatures of the two streams the same? Where in the streams were the
data taken? Why were these points chosen? Are they representative?
Why do you think the statistician asked these questions? Are there other questions that
should have been asked? Is there any set of answers to these questions that would justify the
use of a t-test to draw conclusions about pollution levels?
© 2002 By CRC Press LLC