
Page 192 - Statistics for Environmental Engineers
P. 192
L1592_frame_C22 Page 192 Tuesday, December 18, 2001 2:43 PM
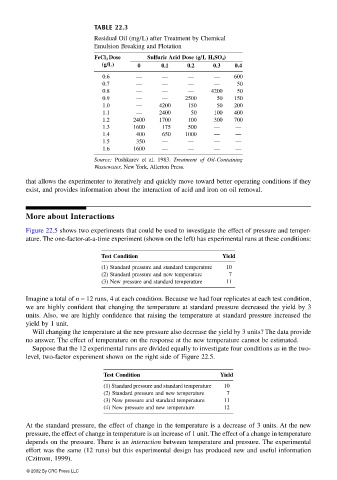
TABLE 22.3
Residual Oil (mg/L) after Treatment by Chemical
Emulsion Breaking and Flotation
FeCl 3 Dose Sulfuric Acid Dose (g/L H 2 SO 4 )
(g/L) 0 0.1 0.2 0.3 0.4
0.6 — — — — 600
0.7 — — — — 50
0.8 — — — 4200 50
0.9 — — 2500 50 150
1.0 — 4200 150 50 200
1.1 — 2400 50 100 400
1.2 2400 1700 100 300 700
1.3 1600 175 500 — —
1.4 400 650 1000 — —
1.5 350 — — — —
1.6 1600 — — — —
Source: Pushkarev et al. 1983. Treatment of Oil-Containing
Wastewater, New York, Allerton Press.
that allows the experimenter to iteratively and quickly move toward better operating conditions if they
exist, and provides information about the interaction of acid and iron on oil removal.
More about Interactions
Figure 22.5 shows two experiments that could be used to investigate the effect of pressure and temper-
ature. The one-factor-at-a-time experiment (shown on the left) has experimental runs at these conditions:
Test Condition Yield
(1) Standard pressure and standard temperature 10
(2) Standard pressure and new temperature 7
(3) New pressure and standard temperature 11
Imagine a total of n = 12 runs, 4 at each condition. Because we had four replicates at each test condition,
we are highly confident that changing the temperature at standard pressure decreased the yield by 3
units. Also, we are highly confidence that raising the temperature at standard pressure increased the
yield by 1 unit.
Will changing the temperature at the new pressure also decrease the yield by 3 units? The data provide
no answer. The effect of temperature on the response at the new temperature cannot be estimated.
Suppose that the 12 experimental runs are divided equally to investigate four conditions as in the two-
level, two-factor experiment shown on the right side of Figure 22.5.
Test Condition Yield
(1) Standard pressure and standard temperature 10
(2) Standard pressure and new temperature 7
(3) New pressure and standard temperature 11
(4) New pressure and new temperature 12
At the standard pressure, the effect of change in the temperature is a decrease of 3 units. At the new
pressure, the effect of change in temperature is an increase of 1 unit. The effect of a change in temperature
depends on the pressure. There is an interaction between temperature and pressure. The experimental
effort was the same (12 runs) but this experimental design has produced new and useful information
(Czitrom, 1999).
© 2002 By CRC Press LLC