
Page 101 -
P. 101
CHAPTER 3 • THE EXTERNAL ASSESSMENT 67
United States in 2000. Americans age 65 and over will increase from 12.6 percent of the
U.S. population in 2000 to 20.0 percent by the year 2050.
The aging American population affects the strategic orientation of nearly all organizations.
Apartment complexes for the elderly, with one meal a day, transportation, and utilities included
in the rent, have increased nationwide. Called lifecare facilities, these complexes now exceed
2 million. Some well-known companies building these facilities include Avon, Marriott, and
Hyatt. Individuals age 65 and older in the United States comprise 13 percent of the total popu-
lation; Japan’s elderly population ratio is 17 percent, and Germany’s is 19 percent.
Americans were on the move in a population shift to the South and West (Sunbelt) and
away from the Northeast and Midwest (Frostbelt), but the recession and housing bust nation-
wide has slowed migration throughout the United States. More Americans are staying in place
rather than moving. New jobs are the primary reason people move across state lines, so with
3 million less jobs in the United States in 2008–2009 alone, there is less need to move. Falling
home prices also have prompted people to avoid moving. The historical trend of people
moving from the Northeast and Midwest to the Sunbelt and West has dramatically slowed.
The worldwide recession is also reducing international immigration, down roughly 10 percent
in both 2008 and 2009. Hard number data related to this information can represent key oppor-
tunities for many firms and thus can be essential for successful strategy formulation, including
where to locate new plants and distribution centers and where to focus marketing efforts.
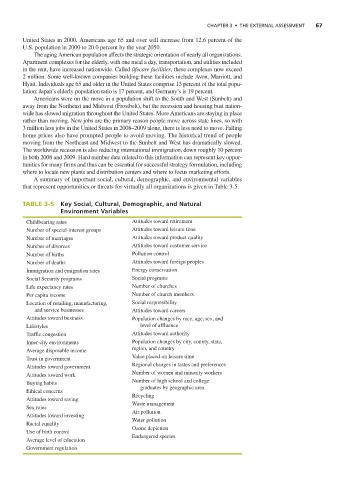
A summary of important social, cultural, demographic, and environmental variables
that represent opportunities or threats for virtually all organizations is given in Table 3-5.
TABLE 3-5 Key Social, Cultural, Demographic, and Natural
Environment Variables
Childbearing rates Attitudes toward retirement
Number of special-interest groups Attitudes toward leisure time
Number of marriages Attitudes toward product quality
Number of divorces Attitudes toward customer service
Number of births Pollution control
Number of deaths Attitudes toward foreign peoples
Immigration and emigration rates Energy conservation
Social Security programs Social programs
Life expectancy rates Number of churches
Per capita income Number of church members
Location of retailing, manufacturing, Social responsibility
and service businesses Attitudes toward careers
Attitudes toward business Population changes by race, age, sex, and
Lifestyles level of affluence
Traffic congestion Attitudes toward authority
Inner-city environments Population changes by city, county, state,
region, and country
Average disposable income
Value placed on leisure time
Trust in government
Attitudes toward government Regional changes in tastes and preferences
Number of women and minority workers
Attitudes toward work
Number of high school and college
Buying habits
graduates by geographic area
Ethical concerns
Recycling
Attitudes toward saving
Waste management
Sex roles
Air pollution
Attitudes toward investing
Water pollution
Racial equality
Ozone depletion
Use of birth control
Endangered species
Average level of education
Government regulation